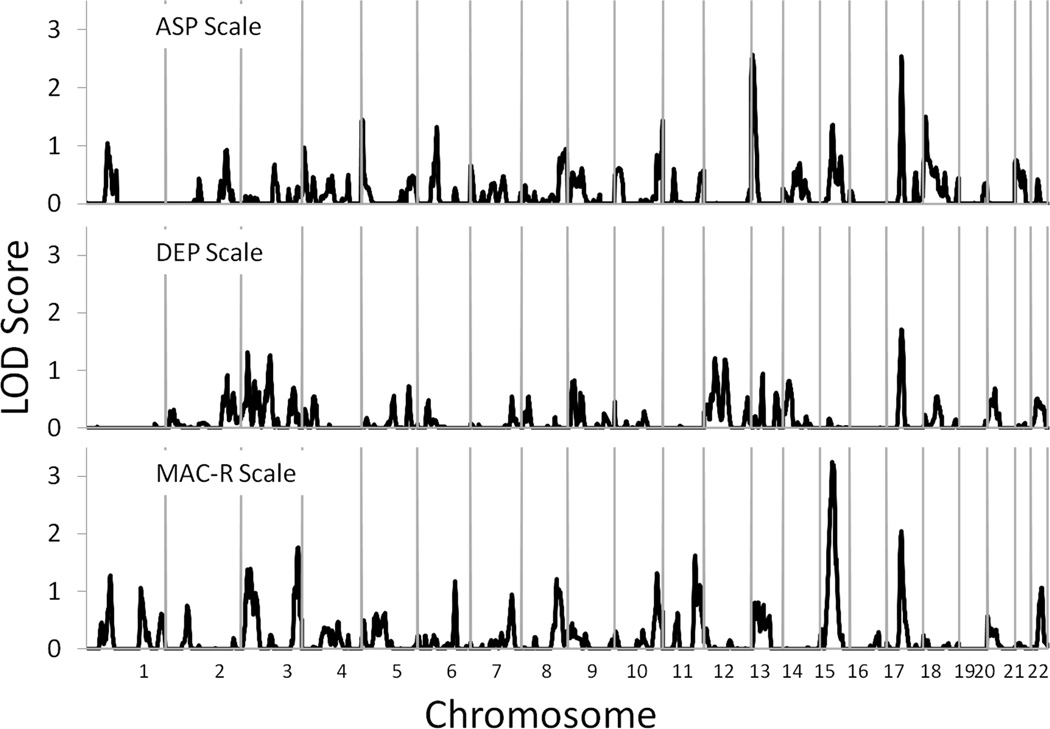
Figure 1.
Multipoint linkage analysis for the Antisocial Practices (ASP), Depression (DEP), and MacAndrew Revised Alcoholism (MAC-R) MMPI-2 scales. Chromosome numbers are displayed on the x-axis, and LOD scores are displayed on the y-axis. Results for each chromosome are aligned end to end with the pterminus on the left. Vertical lines indicate the boundaries between chromosomes.

