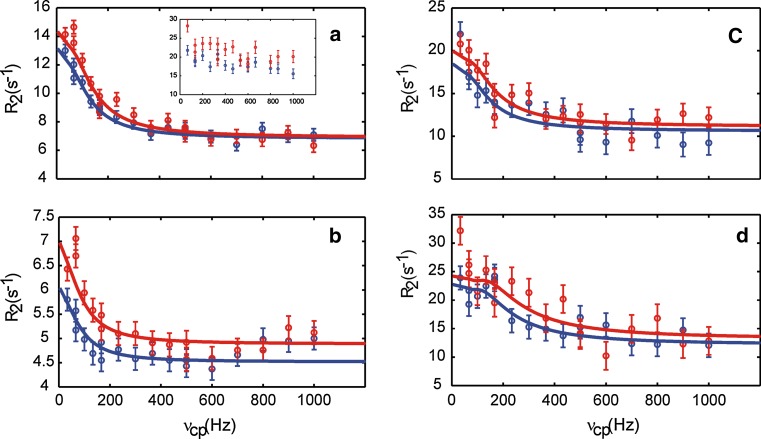
Fig. 2.
Representative 13C aromatic L-TROSY-CPMG relaxation dispersion profiles acquired on a 0.4 mM sample of CspB in 10 mM HEPES pH 7.0 at 25 °C and static magnetic field strengths of 11.7 T (blue) and 14.1 T (red). Data are shown for residues F15δ* (a), F38δ* (b), W8δ1 (c) and H29ε1 (d). The inset in panel a shows the corresponding data acquired with the rc-CPMG sequence. The solid lines in (a–d) represent global fits of the folding–unfolding model to the experimental data. Relaxation delays where chosen so as to get the same signal decay (about 50 %) in all experiments, resulting in delays of 60 ms (L-TROSY-CPMG) or 30 ms (rc-CPMG). Supplementary Information Figure S1 shows results for all residues, including rc-CPMG data and L-anti-TROSY-CPMG data

