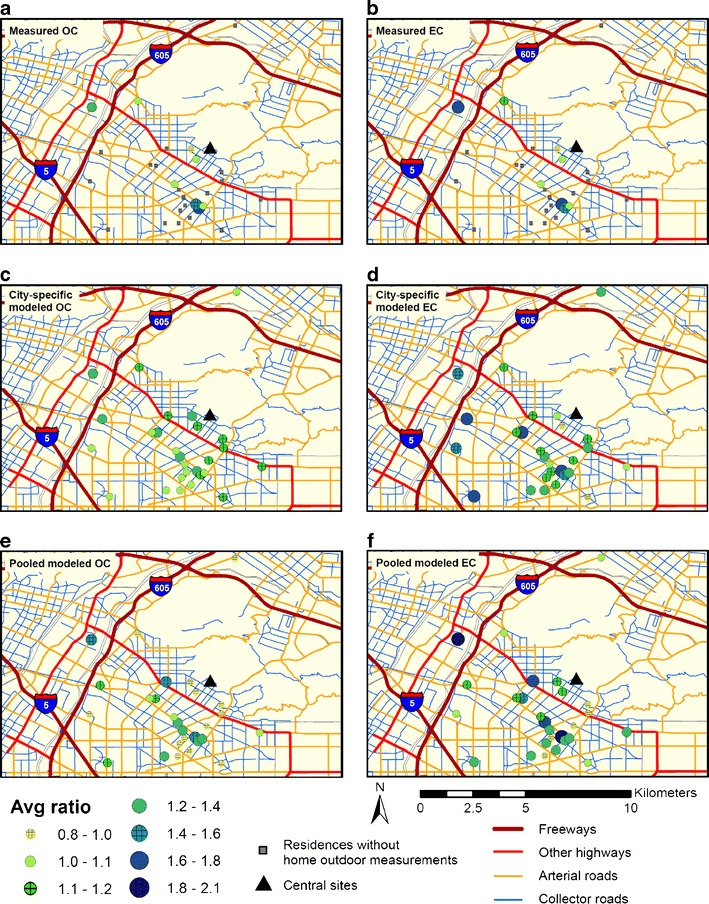
Fig. 3.

Plots of 10-day average ratios of home outdoor to central site OC (left panel) and EC (right panel) levels in Whittier, using measurements (a and b), city-specific model predictions (c and d), and pooled model predictions (e and f)

Plots of 10-day average ratios of home outdoor to central site OC (left panel) and EC (right panel) levels in Whittier, using measurements (a and b), city-specific model predictions (c and d), and pooled model predictions (e and f)