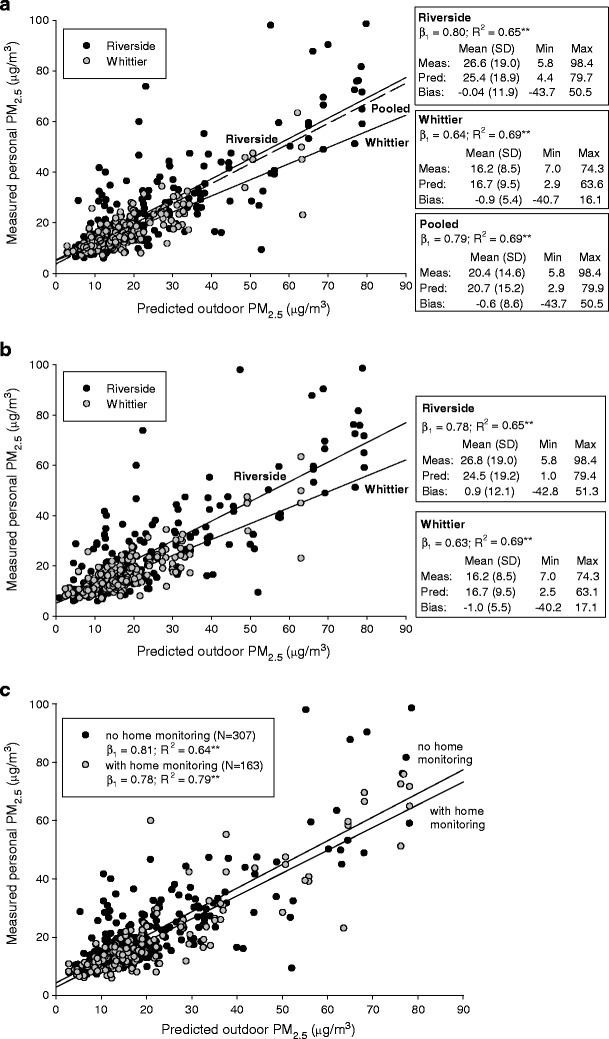
Fig. 5.

Relationship between measured personal PM2.5 and predicted home outdoor PM2.5 from concentration models with a random “home” effect using a a pooled model, b city-specific models, and c grouped by monitored homes from the pooled model (β 1 = estimate of regression slope; **p < 0.01). Statistics for measured (Meas) and predicted (Pred) PM2.5 and the Bias are provided in text boxes
