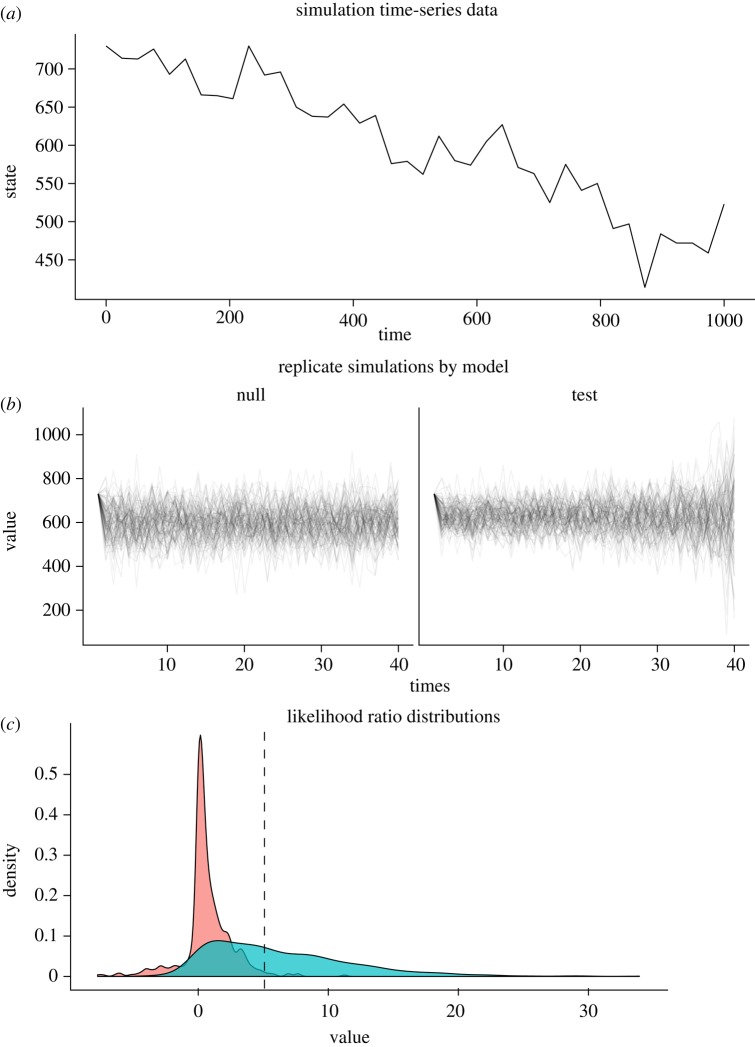
Figure 2.
A model-based calculation of warning signals for the simulated data example. (a) The original time-series data on which model parameters for equations (3.2) and (3.4) are estimated. (b) Replicate simulations under the maximum-likelihood estimated (MLE) parameters of the null model, equation (3.4) and test model, equation (3.2). (c) The distribution of deviances (differences in log likelihood, equation (3.12)), when both null and test models are fit to each of the replicates from the null model, ‘null’, in red, and these differences when estimating for each of the replicates from the test model, in blue. The overlap of distributions indicate replicates that will be difficult to tell apart. The observed differences in the original data are indicated by the vertical line. (Online version in colour.)

