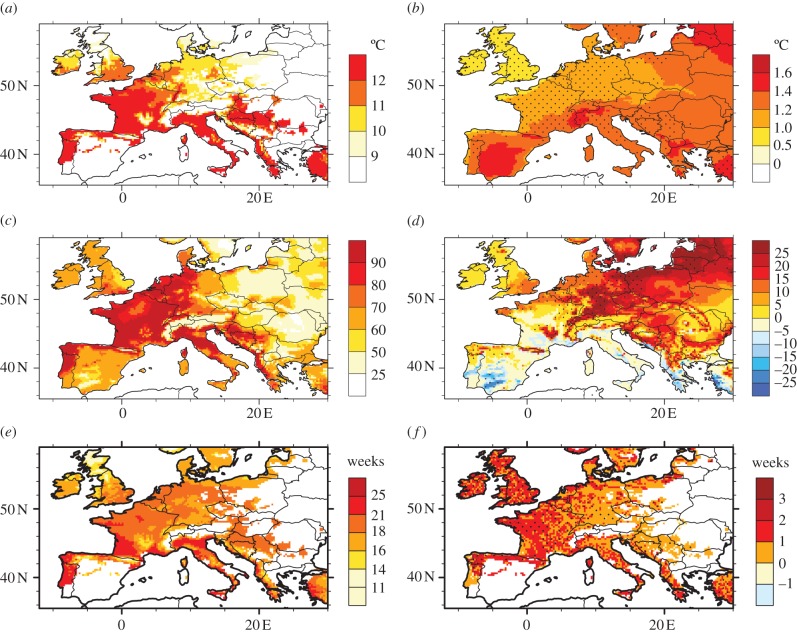
Figure 4.
Future climate suitability of A. albopictus based on different models (rows). The left column depicts the mean suitability based on the ensemble mean of all RCM-driven projections for 2030–2050. The right column shows the future changes (2030–2050) with respect to the 1990–2009 climatology. The black dots depict the areas where the simulated mean changes are greater than two times the regional climate model ensemble standard deviation. (a) Mean future climate suitability based on model 1. (b) Annual temperature future change based on model 1. (c) Mean future climate suitability based on model 2. (d) Future suitability changes based on model 2. (e) Weeks of adult mosquito activity for 2030–2050 based on model 3. (f) Changes in adult mosquito activity for 2030–2050 based on model 3.

