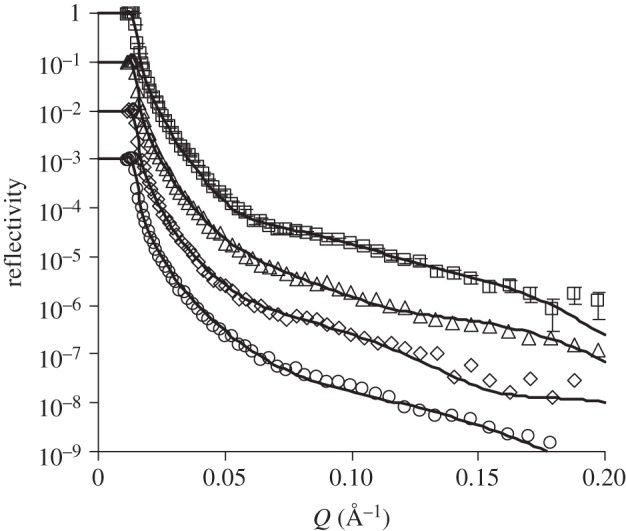
Figure 5.

NR profiles at the SiO2–buffer interface measured from anti-hPSA antibody adsorption (10 mg l–1, pH 7) with ionic strengths of 5 (open squares), 20 (open triangles), 50 (open diamonds) and 100 (open circles) mM. The solid lines are the best fits, while the symbols are the measured data. For clarity, data at 20, 50 and 100 mM of salt have been shifted down 1–3 magnitudes along the vertical axis. Error bars are shown for only one dataset. The levels of experimental errors are similar between the different reflectivity profiles as shown in the figure. Parameters obtained by data fitting are shown in table 2.
