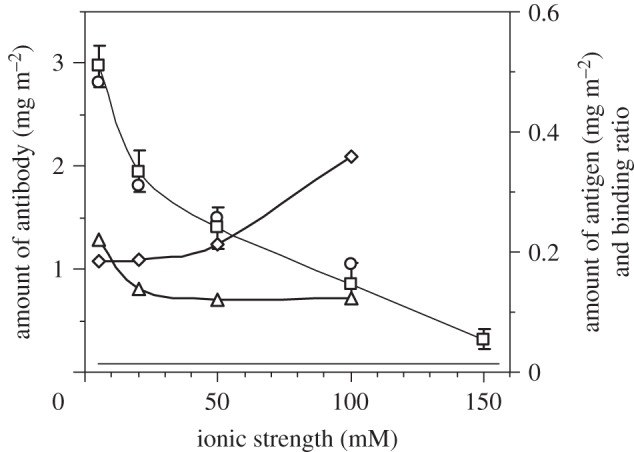
Figure 6.

The amount of the surface-adsorbed antibody (left axis) obtained by ellipsometry (open squares) and NR (open circles) under different ionic strengths with their corresponding antigen-binding amount (open triangles, right axis) and binding ratio (open diamonds, right axis). Lines are for eye guidance.
