Figure 7.

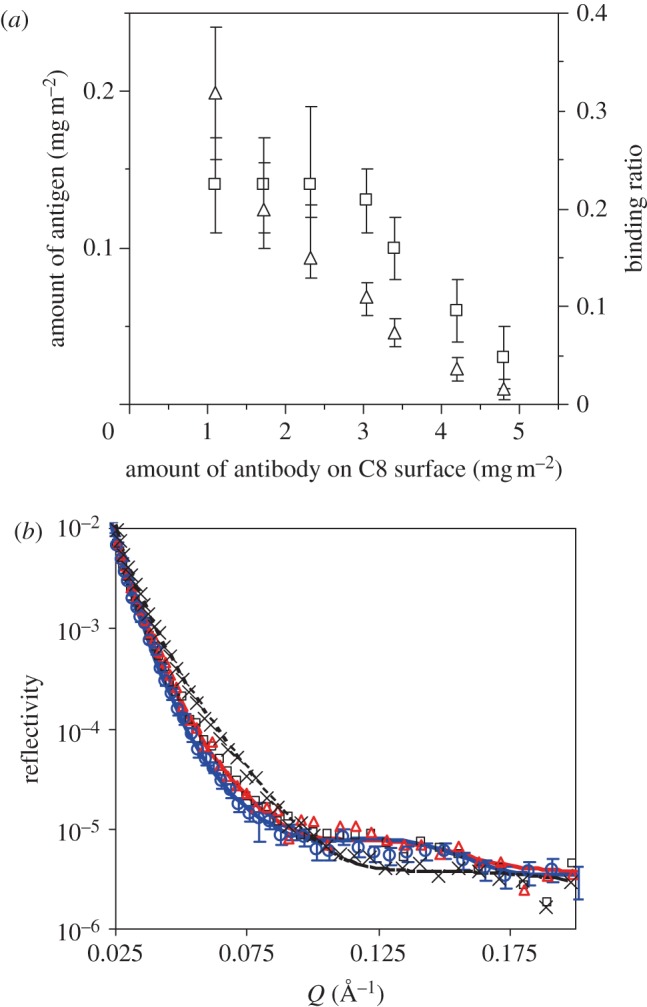
(a) Antigen-binding amount (left axis, open squares) and binding ratio (right axis, open triangles) against surface-immobilized antibody at the C8–buffer interface obtained by ellipsometry. For each experiment, antigen was allowed to bind for 15–20 min. (b) NR profiles measured at the C8–buffer interface (cross symbols), followed by antibody adsorption (open squares), BSA blocking (open triangles) and then antigen binding (open circles). The concentrations for antibody, BSA and antigen are 10, 50 and 5 mg l–1, respectively. For each step, adsorption is allowed for 1 h, followed by a buffer wash. Phosphate buffer in D2O at I = 20 mM, pH 7 was used for the experiments. The lines are the best fits, while the symbols are the measured data. For clarity, error bars are shown only for the last dataset. The levels of experimental errors are similar between the different reflectivity profiles shown in the figure. Parameters obtained by the data fitting are shown in table 3. (Online version in colour.)
