
Figure 1.
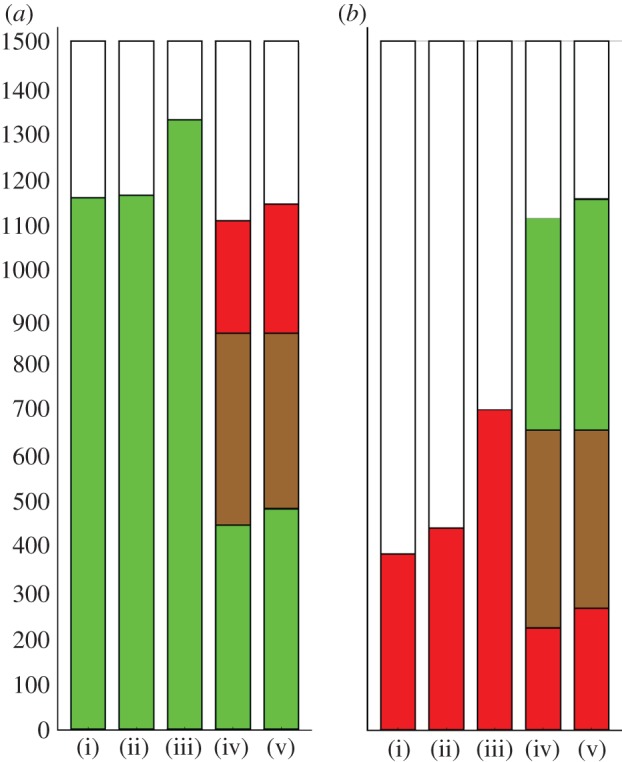
Sequential challenge of macrophages with G and R bacteria. Each bar represents 1500 BMDM, pooled from three separate replicates of 500 BMDM, and the colours show the number of BMDM infected by G (green), R (red), both G and R (brown) or uninfected (white). Each challenge was with an MOI of 50. (a)(i) Cells were challenged with G for 30 min then counted, or (ii) challenged with G for 30 min, washed to remove extracellular bacteria and left for a further 30 min before being counted: in either case, about 80% of cells contained G. (iii) as (ii) but cells were challenged again with G for 30 min after the washes: more cells were infected by G than in (i) and (ii). (iv) as (ii) but challenged with R for 30 min after the washes. The proportion of cells infected by G alone in (iv) was clearly less than in (i) or (ii), most of the difference being accounted for by cells infected by both G and R. (b) An equivalent set of experiments, but with G and R swapped. The infection rate of R is lower, but the same qualitative result holds. (a,b) (v) Gives the expected counts under the null hypothesis of independence of G and R infection (see main text). (a,b) Cells infected with both G and R, and uninfected cells were observed more frequently than expected (p < 10−4).