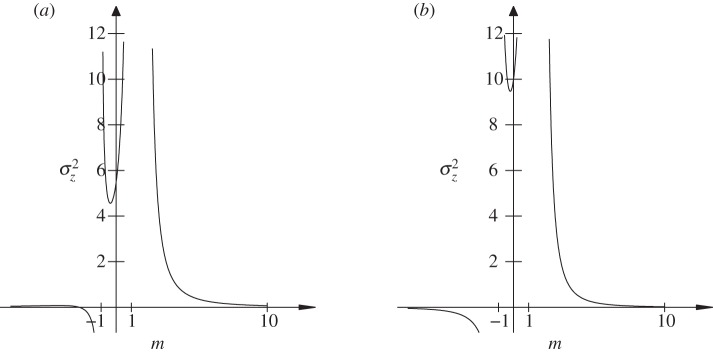
Figure 3.
The expected equilibrium phenotypic variance (equation (3.1)) is positive for a restricted range of values of m, where m is the maternal effect coefficient. Outside this range, the system cannot reach an equilibrium state.  ,
,  and δ = 10, for (a)
  and (b)
  . The case where
  looks very similar to (b), but with
  very small and negative for
  .
.

