Abstract
The hunting spider Cupiennius salei uses airflow generated by flying insects for the guidance of its prey-capture jump. We investigated the velocity field of the airflow generated by a freely flying blowfly close to the flow sensors on the spider's legs. It shows three characteristic phases (I–III). (I) When approaching, the blowfly induces an airflow signal near the spider with only little fluctuation (0.013 ± 0.006 m s−1) and a strength that increases nearly exponentially with time (maximum: 0.164 ± 0.051 m s−1 s.d.). The spider detects this flow while the fly is still 38.4 ± 5.6 mm away. The fluctuation of the airflow above the sensors increases linearly up to 0.037 m s−1 with the fly's altitude. Differences in the time of arrival and intensity of the fly signal at different legs probably inform the spider about the direction to the prey. (II) Phase II abruptly follows phase I with a much higher degree of fluctuation (fluctuation amplitudes: 0.114 ± 0.050 m s−1). It starts when the fly is directly above the sensor and corresponds to the time-dependent flow in the wake below and behind the fly. Its onset indicates to the spider that its prey is now within reach and triggers its jump. The spider derives information on the fly's position from the airflow characteristics, enabling it to properly time its jump. The horizontal velocity of the approaching fly is reflected by the time of arrival differences (ranging from 0.038 to 0.108 s) of the flow at different legs and the exponential velocity growth rate (16–79 s−1) during phase I. (III) The air flow velocity decays again after the fly has passed the spider.
Keywords: spider, blowfly, flow field, particle image velocimetry, orientation, prey capture
1. Introduction
Arthropods possess a wide range of sensory organs, which include sensors responding to air or water medium displacement. Many spiders use airflow sensors with high sensitivity and a particular selectivity for the biologically relevant signals to detect and localize prey and predators [1].
Here, we report an experimental work with airflow-sensing filiform hairs, or trichobothria, of the wandering spider Cupiennius salei. Each of this spider's eight legs carries approximately 100 such sensors, arranged in specific patterns. Different sensor clusters contain between two and 24 hairs (diameter at base ca 10 µm, length ca 100–1400 µm). According to earlier work [2], the range of hair lengths in a cluster works to extend the frequency range of mechanical sensitivity when compared with that of an individual hair. Theoretical ([3–5]; review: [6]) and experimental studies [2,7,8] demonstrated that the trichobothria of Cupiennius respond to velocity oscillations down to peak-to-peak (p-p) amplitudes as small as 0.15 mm s−1 and are mechanically broadly tuned to stimulus frequencies between approximately 40 and 600 Hz. Natural stimuli such as the airflow generated by a flying insect elicit prey-capture behaviour in the spider [7,9]. The flow in a fly's wake is highly three-dimensional, unsteady and vortical and, as a result, rich in spectral content [8].
Remarkably, Cupiennius is able to catch flying insect prey such as flies by jumping into the air even when blinded. Its success relies on the detection, recognition and localization of an airborne moving object and on the jump's proper timing. Following the ablation of the trichobothria, the jump cannot be elicited anymore [9]. The airflow sensed is invariant in a frame of reference moving with the fly. What the spider senses depends only on the altitude, distance and orientation of the fly with respect to the spider.
We asked two main questions.
(1) What cues contained in the fly-generated airflow are used by Cupiennius to detect, recognize and localize flying prey and to properly trigger the jump? (2) Do additional sensory modalities other than airflow play an obligatory role in its prey-capture behaviour?
Accordingly, three experimental issues are addressed. (i) Analysis of the airflow generated by a fly close to the spider's sensors using digital particle image velocimetry (DPIV). (ii) Evaluation of the potential relevance of additional sensory modalities such as sound pressure and substrate vibration. (iii) Application of artificial flow patterns imitating characteristic features of the natural flows to see which flow parameters are indeed used by the spider.
Whereas the present paper focuses on the analysis of the airflow generated by a freely flying fly, the companion paper [10] deals with the significance of this flow in regard to prey-capture behaviour. Flight kinematics, the airflow around the flapping wings and the generation of aerodynamic forces are well covered by the literature [11–21]. The present work for the first time describes the entire flow field around freely flying flies, focusing on the flows near the spider in a biologically relevant setting.
2. Material and methods
2.1. Experimental animal: blowfly
The common blowfly (Calliphora erythrocephala) served as a source of natural airflow. When using tethered animals, the flies were connected to a stiff rod by a small strap of paper glued onto their thorax. Their long axis then formed an angle of ca 20° with the horizontal as was also measured in flies flying freely in a horizontal plane.
2.2. Sound pressure measurements
Airborne sound emitted by a humming blowfly is a potential clue used by the spider. We therefore recorded the sound field around a tethered flying blowfly (Brüel & Kjaer probe microphone type 4182; measuring amplifier type 2610).
In addition to using stationary flies, the humming fly was also artificially moved over the spider to further mimic the natural situation. The maximum flight velocity of a blowfly is approximately 1.2 m s−1 [22]. Since the maximum frequency shift owing to the Doppler effect is only 0.35 per cent and very small relative to the frequency variations between individual flies (up to 35%), it could be neglected.
For the acoustic measurements, the analogue signal was digitized (A/D board type 1401, CED Ltd) and transferred to a Pentium 4 PC. Spike2 software (v. 6.10; CED) served to record the acoustic data with a temporal resolution of 20 kHz. Both the fast Fourier transform (FFT) and the sonogram were calculated using a Hanning window (frame length) of 4096 points (i.e. 0.2 s) with a corresponding frequency resolution of 4.88 Hz. The grey scale of the sonogram ranged from a sound pressure level (SPL) of 0 dB (white) to 96 dB (darkest grey).
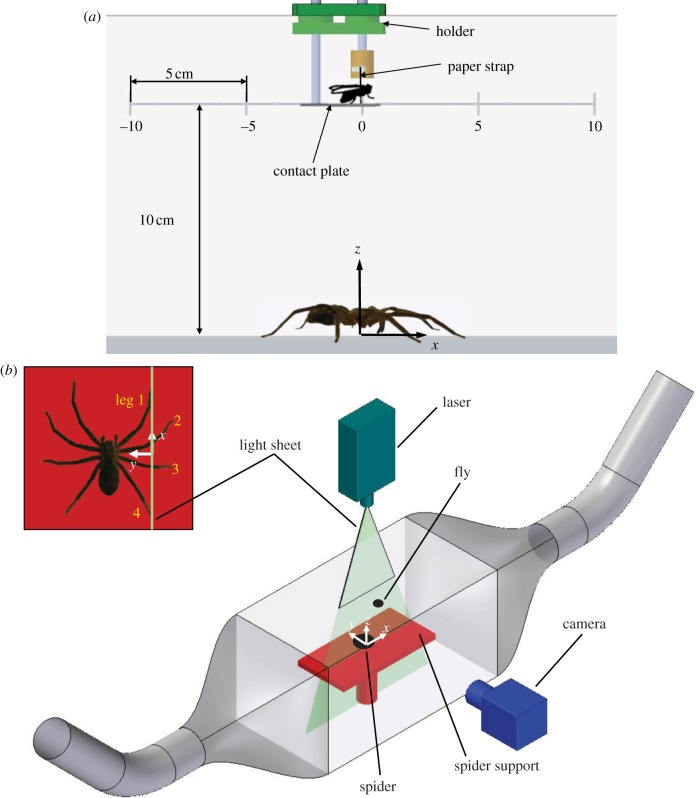
The microphone was positioned in the vertical symmetry plane (x–z) of the fly and in two horizontal planes (x–y), 10 and 50 mm below the fly's thorax (figure 1a). Measurements in the vertical plane were taken using a 5 × 5 grid with the z-positions at 0, 10, 30, 50 and 70 mm and the x-positions at 0, 25, 50, 75 and 100 mm (measured with respect to the position of the fly). Measurements in the origin of the coordinate system (x = 0, y = 0, z = 0) were not possible because of the fly's presence at this position. The horizontal planes formed a 5 × 5 grid ranging (step size 25 mm) from x = 0 to x = 100 mm and from y = −50 to y = +50 mm.
Figure 1.
(a) Measurement of the airflow around a stationary humming blowfly with the fly at various positions (here: x = 0, y = 0, z = 10 cm). Other fly positions at x = −10, −5, +5, +10 cm are indicated by the grey scale. (b) Set-up to measure the airflow generated by a fly freely flying inside the Perspex box. To avoid backflow, two sidewalls were replaced by open tubes. The vertical laser light sheet cuts all four legs on the spider's right side (see inset at top left and §3.2.3); legs 1 and 4 cut at the tarsus, legs 2 and 3 at the tibia.
The pressure field owing to the harmonics of the wing beat frequency was calculated in dB SPL (re 20 µPa). To this end, the bin of the spectrum containing the frequency peak and both bins on each side of it were evaluated following the CED manual (2004) as the harmonics spread over more than one bin width (4.88 Hz).
2.3. Digital particle image velocimetry
The DPIV system (Dantec Dynamics A/S, Skovlunde, Denmark) used to measure the airflow velocity vectors consisted of two Nd:YAG lasers (3 W/532 nm, Mercury series, New Wave Research Inc., Fremont, CA, USA) coupled to a dual laser unit. The laser optics (80 × 60 series, Dantec Dynamics A/S) generated a pulsed light sheet of 2 mm waist thickness at its focal point. The camera position was such that its axis was always at a right angle with regard to the plane of the laser sheet. The repetition rate of the laser pulses was up to 100 kHz. A digital high-speed camera (iNanoSense MkIII revision 3E, Integrated Design Tools Inc., Tallahassee, FL, USA) with a complementary metal oxide semiconductor chip (CMOS) allowed up to 1000 single frames per second at its highest spatial resolution of 1280 × 1024 pixels. The camera featured a special light intensifier for high-quality measurements with reduced laser power so as not to damage the animals. It had an internal flash memory of 4096 MB which could store up to 3272 frames at highest resolution during one measurement. A Nikon AF Nikkor 85 mm f/1.8D lens was used with a 12 mm spacer ring (Soligor GmbH, Leinfelden-Echterdingen, Germany). The laser and the camera were synchronized using a Timing Hub (X-Stream series, Integrated Design Tools Inc.) connected via USB to a Dell Precision PWS670 PC (Intel Xeon 3.6 GHz, 3 GB of random access memory). Data acquisition and post-processing were performed using versions 1.30 to 2.21 of the DynamicStudio software (Dantec Dynamics A/S). The frames were acquired in single-frame mode, keeping the time lag between frames constant and allowing correlation of frames 1 and 2, 2 and 3, etc. Adaptive correlation (cross correlation with moving average validation and interrogation area offset) was used to calculate the dimensional velocity–vector field in the measurement plane. Each velocity vector is composed of a horizontal (Ux) and a vertical (Uy) component and its absolute value,  , is referred to as the velocity magnitude. The size of the interrogation area varied from 32 × 32 to 64 × 64 pixels with 50 per cent overlap, depending on the experiment, and was chosen to render uncertainties due to out-of-plane particle displacement as negligible. The origin of the DPIV (x − y/Ux − Uy) system of coordinates was at the bottom left-hand corner of each image.
When the fly had started to fly generating airflow above a threshold level set to 8.1 cm s−1, the DPIV system was triggered (delay 0.001 s) using a constant temperature anemometer (CTA; multichannel CTA 54N81, Dantec Dynamics A/S; position 1 cm above the edge of the spider support at coordinates x = −15, y = 0, z = 1 cm) with a one-dimensional fibre film probe (55R01 series, Dantec Dynamics A/S). The system offered the option to save frames prior to reaching the threshold.
Seed particles (diameter 2 µm) were produced by a fog generator (Flow Tracker 700 CE, Dantec Dynamics A/S) using Inside Fog Fluid Super (Safex-Chemie GmbH, Schenefeld, Germany), which did not affect the performance of the CTA.
The highest frequency contained in the air motion caused by a tethered flying fly is below 600 Hz [8]. In the worst case (600 Hz), the velocity magnitude of a 2 μm seed particle is at least 99.9 per cent of that of the air motion it tracks, and its phase lag with respect to the airflow is ca 0.09° [23]. The maximal error regarding acceleration is 1 per cent [23]. Therefore, errors owing to the inertia of the seeding particles are negligible.
By storing pre-trigger images at the beginning of each measurement, the degree of unwanted flow disturbance was checked. In case of any such disturbance, data were not taken.
2.3.1. Stationary, experimentally moved and freely flying blowfly
A Perspex box (55 × 30 × 30 cm3) shielded the fly-generated flow from external perturbations and confined the seeding agent to the measurement volume. The seeding particles were introduced through an opening in the box which could be closed. To sufficiently reduce possible backflow from the walls orientated perpendicular to the main flow direction, these were covered by rubber foam.
The paper strap attached to the blowfly was clamped to the fly holder. A small platform provided tarsal contact for the fly, which started flying when its tarsal contact was removed. The fly holder could be moved in the x-direction and arrested at the desired positions (figure 1a).
Figure 1b shows the arrangement of the DPIV system's camera and laser for flow analysis within a vertical plane (x, z). For the analysis in a horizontal plane (x, y), the positions of the laser and the camera were switched. The hot-wire sensor of the trigger device was 2 cm behind and 0.5 cm above the fly in order not to influence the flow behind and below the fly. This same set-up was used when the humming fly was experimentally moved together with its support (see §3.2.2.). The actual speed of the manually pulled fly was determined by evaluating the position of the fly at particular instances on the DPIV pictures.
The stationary fly was kept at z = 5 cm (x = 0, y = 0 cm) above the spider support, which is the height from which the spider commonly caught it under natural conditions [10]. To avoid disturbance of the flow field measured above the Perspex plate, the spider was removed. The laser sheet was orientated either vertically (in the symmetry plane x–z of the fly) or horizontally (x–y-plane). The horizontal light sheet was 5 mm below the insertion points of the fly's wings, which best allowed both the suction flow region in front of the fly and the wake region to be analysed with sufficient spatial resolution.
The full image size of 1280 × 1024 pixels was used to record from an area of 7.8 × 6.2 cm2 (vertical laser sheet) and 4.9 × 3.9 cm2 (horizontal laser sheet). Single frames were recorded at 1000 Hz with an interrogation area of 32 × 32 pixels with 50 per cent overlap. With these settings, the entire velocity range from a few mm s−1 to 1 m s−1 could be well resolved. One hundred pre-trigger images were recorded and 150 individual velocity fields (frames) averaged to obtain a good approximation of the temporal mean flow.
To analyse the flow field around a freely flying blowfly is a demanding task. A fly was released inside the Perspex box with the hot-wire trigger positioned at one end of the spider support (figure 1b) and 1 cm above it (x = −15, y = 0, z = 1 cm) to reliably trigger the DPIV measurement when the fly was flying close to the camera's image section. Preliminary experiments showed backflow reflected from the walls. Tube openings were placed flush with the top lid of the Perspex box to keep the seeding particles inside the test section (figure 1b). Single frames were recorded at 1000 Hz. With a spatial resolution of 1280 × 1024 pixels, an image area of 7.7 × 6.2 cm2 could be analysed. The interrogation area was enlarged to 64 × 64 pixels with 50 per cent overlap in order to compensate for variable seeding densities as the start of the measurement could not be precisely timed when working with a freely flying fly.
As it turned out, it is crucial to use freely flying flies for experiments aiming at the analysis of the flow fields close to the spider flow sensors. For such experiments, a dead animal was placed in its natural hunting position [9] onto the centre of a flat rectangular Perspex plate (15 × 30 cm2) 15 cm above the floor of the box and levelled horizontally (figure 1b). The origin of the x, y, z -coordinate system was defined to be in the centre of the plate (figure 1b).
2.4. Statistical tests
The Mann–Whitney test (U-test) was used to compare independent samples, whereas the Wilcoxon signed-rank test served to interpret two related samples or repeated measurements on a single sample. Both non-parametric tests were performed using the software xlstat 2009. The chosen level of significance was 5 per cent.
3. Results
3.1. Airborne sound
When the flying blowfly passes over the spider, its wing beat causes airborne sound [24]. In principle, trichobothria are able to perceive the air particle velocity induced by pressure fluctuations and therefore were originally called ‘auditory hairs’ by Dahl [25], who first described them [1]. The main question here is: Is the air particle velocity induced by the fly-generated airborne sound strong enough to be detected by the trichobothria of Cupiennius?
The acoustic measurements were performed with two male flies and one female fly whose wing beat frequencies varied between 130 and 200 Hz.
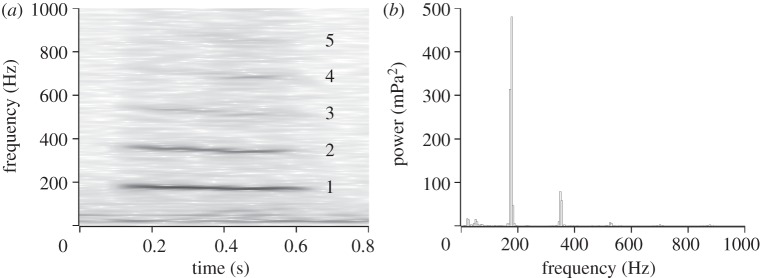
Sonograms (figure 2) clearly show the first and second harmonic of the wing beat frequency, much less so the third, fourth and fifth harmonics, which were too weak to be reliably resolved. A narrow frequency bandwidth of only 20 Hz is typical of all harmonics. Two small peaks at 20 and 50 Hz are due to noise present even in the absence of the humming fly.
Figure 2.
(a) Sonogram and (b) FFT of sound measured in the humming fly's symmetry plane 10 mm below and 25 mm in front of it.
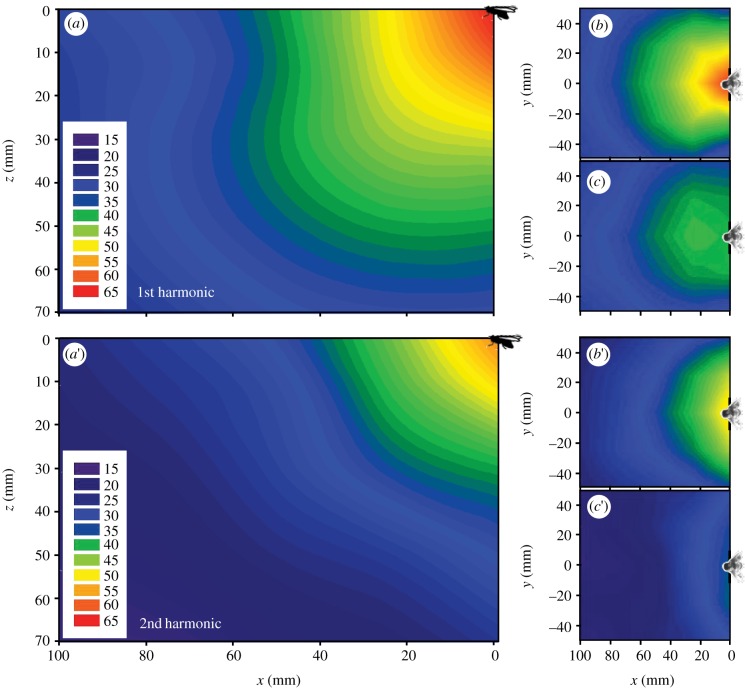
The pressure owing to the first harmonic ranged from 63.6 dB SPL (at x = 0, y = 0, z = 10 mm) to 25.1 dB SPL (100, 0, 70; figure 3a–c). The values for the second harmonic at the identical grid points were significantly lower (p < 0.0001, Wilcoxon signed-rank test, null hypothesis: no difference) measuring between 51.3 dB SPL and 17.2 dB SPL (figure 3). The sound pressure distributions of the first and second harmonic in both horizontal planes were symmetric with respect to the symmetry plane of the fly (first harmonic, p = 0.784; second harmonic, p = 0.985; Wilcoxon signed-rank test, null hypothesis: no difference).
Figure 3.
(a–c) Colour-coded pressure fields in dB SPL of the first harmonic (wing beat frequency) around a stationary humming blowfly (N = 3, n = 15). (a) Vertical symmetry plane of the fly (x–z-plane). (b,c) Pressure field in the horizontal planes (b) 10 mm and (c) 50 mm below the fly's thorax. (a′–c′) Same for the second harmonic (double wing beat frequency) (N = 3, n = 15). (a′) Vertical symmetry plane of the fly (x–z-plane). (b′,c′) Pressure field in the horizontal planes (b′) 10 mm and (c′) 50 mm below the fly's thorax.
In summary, the sound pressure associated with the first harmonic was radiated in a roughly dipole-like pattern (figure 3a–c), whereas the sound pressure pattern of the second harmonic was more like that associated with a monopole (figure 3a′–c′). These results will be compared with those found for another fly [26] in §4.
As the adequate stimulus of trichobothria is particle velocity, sound pressure should be converted into particle velocity. However, this conversion is problematic in the sound near field. We therefore directly measured the deflection of the trichobothria in live animals exposed to the sound radiated from a blowfly to evaluate the possibility of their physiological stimulation [10].
3.2. Flow field around the blowfly and above the spider
The flow field around the blowfly was measured for three configurations in order to judge the relevance of the fly's mobility for its structure. (i) Stationary humming fly, (ii) artificially moved humming fly, and (iii) freely flying fly. In addition, we determined the flow field close to the trichobothria of Cupiennius sitting below the freely flying fly.
3.2.1. Stationary tethered blowfly
The temporal mean flow field around a stationary fly, flying 5 cm above the substrate, was measured in both the horizontal and vertical planes. Figure 4a shows the flow field in a horizontal plane 5 mm below the thoracic articulation of the fly's wings. In the wake of the humming blowfly, the velocity vectors were directed backwards from the fly and reached values of up to 65 cm s−1. The strong wake entrained air from below and above the wake and the air close to it was flowing towards it. In agreement with mass conservation for an incompressible fluid, the air in front of the fly was sucked towards the wings with velocities of up to 23 cm s−1.
Figure 4.
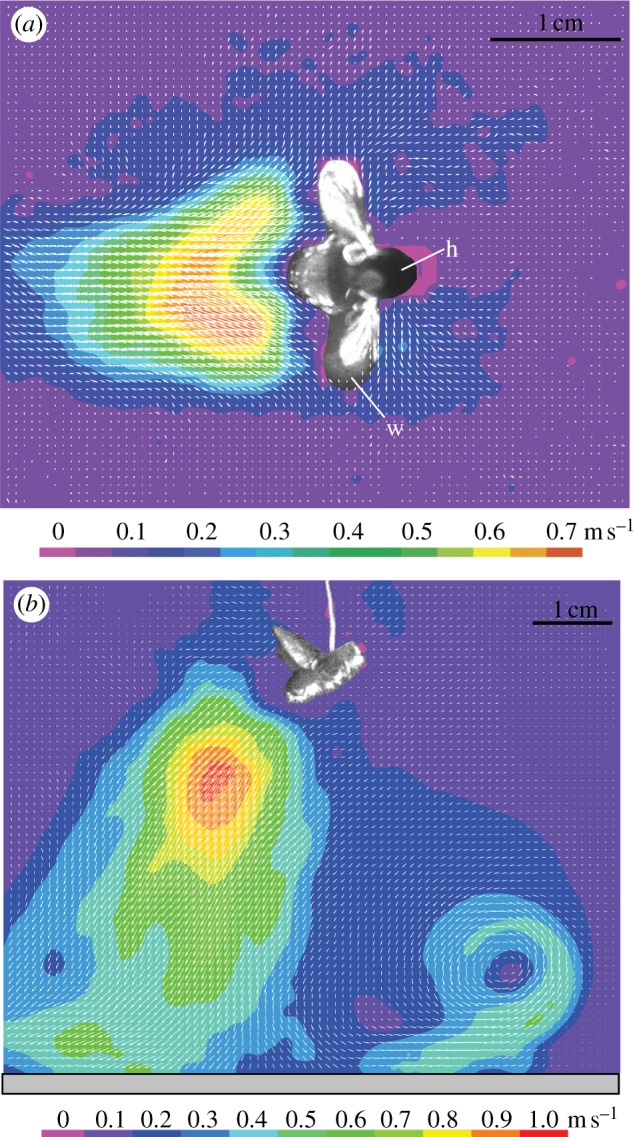
(a) Flow field around a stationary flying blowfly in a horizontal plane 5 mm below the level where the wings are attached to the fly's thorax and with a horizontally orientated Perspex plate (30 × 15 cm2) located 5 cm below the fly. The vector map shows the calculated mean of 150 individual velocity fields (measurement duration for each 0.15 s). Colours refer to different velocity magnitudes (see scale). w, wing; h, head. (b) Flow field around a stationary flying blowfly in the vertical symmetry plane of the fly and with a horizontally orientated Perspex plate (see grey bar) located 5 cm below the fly taking ‘ground effects’ into account.
Velocity vectors were also measured in the vertical symmetry plane of the fly (six individuals, n = 19). The general observation was that the velocity in the wake (in agreement with Barth & Höller [8]) is directed downwards and backwards from the fly (figure 4b), which uses the corresponding momentum to move forward and upward against gravity. Air on top also gets sucked towards the fly from the front (figure 4b). The corresponding velocity vectors are directed towards the wings. By placing a horizontally orientated substrate 5 cm below the fly, the cone-shaped wake impinged obliquely onto the wall and was split into two jets in forward and backward directions (figure 4b). The forward jet detached from the wall and formed a vortex rotating counterclockwise ahead of the fly (figure 4b, lower right).
Figure 5 shows the flow velocity magnitude along the axis of the cone-shaped wake at various distances from the fly's abdomen. The overall shapes of the curves were similar for all measured samples. Close to the fly, the velocity magnitude increased abruptly and reached a maximum at 10–30 mm behind it. Velocity maxima were around 1 m s−1 (except for one fly, which reached 2.4 m s−1) and decayed smoothly.
Figure 5.
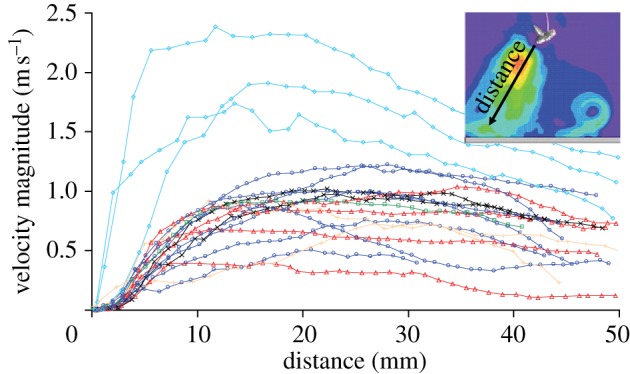
Velocity magnitude along the central axis of the cone-shaped wake region behind stationary humming (flying) blowflies (N = 6, n = 19). The x-axis corresponds to the distance from the rear end of the fly's abdomen (0 mm) along the central axis of the cone (see inset; the colour key is the same as in figure 4b).
3.2.2. Tethered flying blowfly moved forward
A second set of experiments should clarify whether the manual pulling of the fly is an appropriate way to estimate the flow field generated around the spider by a freely flying blowfly. Manual pulling instead of free flight would significantly facilitate the experiments.
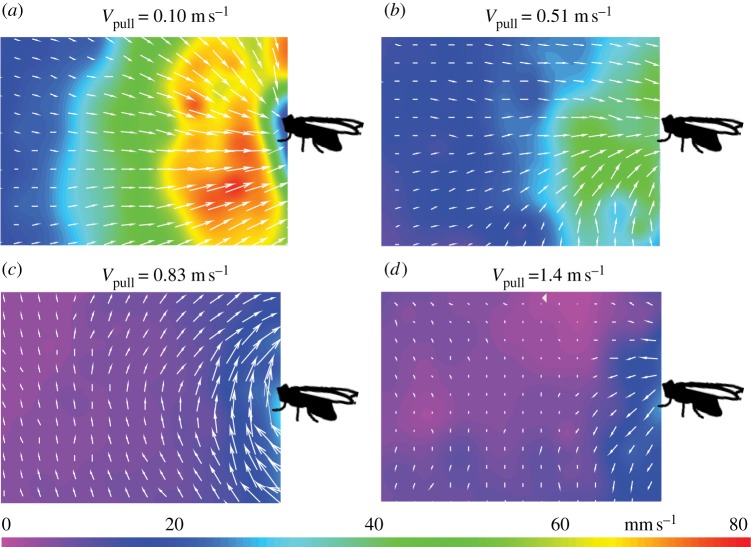
Figure 6 presents representative velocity fields in front of a humming blowfly pulled at various speeds. According to Schilstra & van Hateren [22], the maximum horizontal velocity of a freely flying blowfly with a sensor coil attached to its thorax is 1.2 m s−1 and its average velocity 0.5 m s−1. At unnaturally low flight velocities (Vpull = 0.10 m s−1), the fly sucked air towards itself (figure 6a), whereas at unnaturally high velocities (Vpull = 1.4 m s−1), air was pushed away from the fly (figure 6d). Clearly, the pulling speed strongly affects the flow field around a humming blowfly.
Figure 6.
(a–d) Velocity field in front of a humming fly (in its sagittal plane, i.e. in the plane of the paper) pulled manually at various velocities (Vpull). Airflow velocity magnitude is colour coded (see scale). The velocities of (b) 0.51 m s−1 and (c) 0.83 m s−1 used to artificially move the fly forward were in the range of those of a freely flying blowfly [22], whereas (a) 0.10 m s−1 was unnaturally low and (d) 1.4 m s−1 unnaturally high. A horizontally orientated Perspex plate was located 5 cm below the fly.
Within the range of possible flight velocities as determined by Schilstra & van Hateren [22], the shape of the flow field around the fly changed significantly (compare figure 6b,c). The difference is most probably owing to differences (ΔV) between the pulling speed (Vpull) and the velocity the fly would have assumed when flying freely (Vfree). The flow field around a freely flying blowfly does not change qualitatively with horizontal speeds ranging from 13 to 81 cm s−1 (figure 7 and table 1). Therefore, manual pulling of a tethered humming blowfly is an inappropriate procedure to mimic the flow field generated by a freely flying fly and reaching the spider. A completely freely flying fly is indeed required to achieve realistic conditions, which considerably complicates the experimental procedure.
Figure 7.
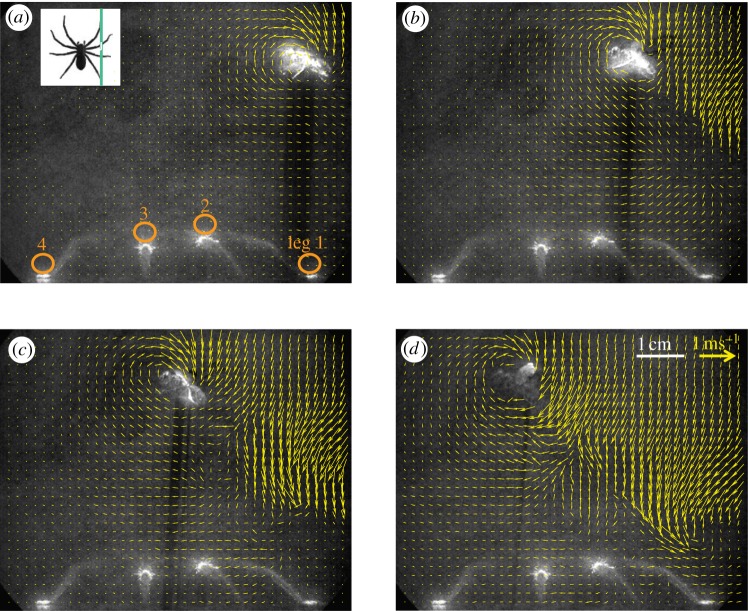
(a–d) Temporal sequence (time intervals: a,b: 27 ms, b,c: 22 ms, c,d: 28 ms) of vector maps showing the flow field around a freely flying blowfly approaching from the right. The illumination of the fly indicates that it flew directly within the measurement plane (laser light sheet). All four legs on the right side of the spider were cut by the laser light sheet providing measurement points above the tarsus of legs 1 and 4 and above the tibia of legs 2 and 3 (orange circles in part a; see also figure 1b). The flow fields evaluated for 26 flights of freely flying blowflies all showed the same general pattern. Inset: spider seen from above and position of laser sheet indicated by green line.
Table 1.
Important parameters evaluated by DPIV measurements of the airflow above Cupiennius and generated by a freely flying blowfly. The mean and r.m.s., the minimum and the maximum values of each parameter were evaluated from n measurements of N flights. Max. velocity, maximum velocity magnitude in phases I and II. Δt legs 1–4, difference of the time of arrival of the velocity signal at legs 1 and 4 (see below). Max. intensity ratio, maximum velocity ratios of neighbouring legs during phase I. Spectrum peak, peak frequency of the power spectrum in each signal phase (see below). Upper frequency limit, frequency range between 0 Hz and the upper limit. Fluctuation, fluctuations of velocity magnitude around the exponential fit of the signal in phase I and around the mean in phase II. Fluct. /mean, fluctuations in the line above are based on the mean value of each phase. Velocity gradient, values of exponential coefficients, are described below. Horizontal velocity and altitude above the spider calculated from all analysed flights.
| fly-generated flow |
N | n | ||||
|---|---|---|---|---|---|---|
| mean ± r.m.s. | min | max | ||||
| max. velocity (m s−1) | phase I | 0.164 ± 0.051 | 0.080 | 0.300 | 25 | 25 |
| phase II | 0.639 ± 0.218 | 0.134 | 1.046 | 25 | 25 | |
| Δt legs 1–4 (s) | start ph I | 0.086 ± 0.019 | 0.038 | 0.108 | 18 | 18 |
| max. intensity ratio | phase I | 4.0 ± 1.3 | 2.2 | 6.5 | 20 | 20 |
| peak of spectrum (Hz) | phase I | 8.2 ± 1.6 | 7.8 | 15.6 | 20 | 68 |
| phase II | 17.9 ± 4.5 | 15.6 | 31.3 | 20 | 68 | |
| upper frequency limit (Hz) | phase I | 84.4 ± 33.0 | 23.0 | 156.0 | 20 | 68 |
| phase II | 247.7 ± 11.5 | 164.0 | 250.0 | 20 | 68 | |
| fluctuation (m s−1) | phase I | 0.014 ± 0.007 | 0.005 | 0.037 | 20 | 62 |
| phase II | 0.113 ± 0.050 | 0.018 | 0.248 | 20 | 62 | |
| fluct./mean (%) | phase I | 33 ± 17 | 8 | 85 | 20 | 62 |
| phase II | 70 ± 23 | 23 | 125 | 20 | 62 | |
| Δphases | 37 ± 26 | −8 | 109 | 20 | 62 | |
| velocity gradient (s−1) | 40.297 ± 14.592 | 16.0 | 79.0 | 20 | 74 | |
| horizontal velocity (cm s−1) | 41.32 ± 16.04 | 12.98 | 81.40 | 26 | 26 | |
| altitude (mm) | 38.76 ± 10.88 | 22.37 | 57.04 | 26 | 26 | |
The flow field around the fly at a pulling speed of Vpull = 0.83 m s−1 (figure 6c) was very similar to that found in front of a freely flying blowfly in all measurements described below. This pulling speed supposedly was identical to the speed the fly would have assumed in free flight (ΔV = 0).
3.2.3. Freely flying blowfly
The question is: Which characteristics of the flow field might the spider use as clues to ensure a successful prey-capture jump? To answer this question, the spatio-temporal structure of the flow field close to the spider's trichobothria and generated by a freely flying blowfly was investigated.
Flow field around a freely flying fly. The velocity field in the vertical symmetry plane of the freely flying blowfly differed from that generated by the stationary tethered and the experimentally moved fly. Figure 7 shows a representative sequence of snapshots of the instantaneous flow field in a vertical plane through a freely flying blowfly. As a key feature, a very strong circulation about the fly is visible with vorticity perpendicular to the plane shown. Together with the forward motion of the fly, a lift force is created (Kutta–Joukowski theorem), similar to that for airfoils. In the wake region extending obliquely downward behind the fly, the flow field was directed nearly vertically downward. Since the velocity vector of the fly is nearly constant over the short flight distance over the spider, the vertically downward flow would essentially appear as an oblique flow. Such a flow is consistent with the direction of the wake measured for the stationary flying fly (figure 4a). The flow field in front of the freely flying fly was similar in shape to that found in the experiment, where the fly was pulled manually (figure 6c) at a velocity in the range of natural flight velocities. The corresponding flows above the spider's legs (see orange circles in figure 7a) of 26 individual flights were quantified (figure 8; n = 10). The velocity information was evaluated in search of the features the spider might use to detect, localize and catch flying prey.
Figure 8.
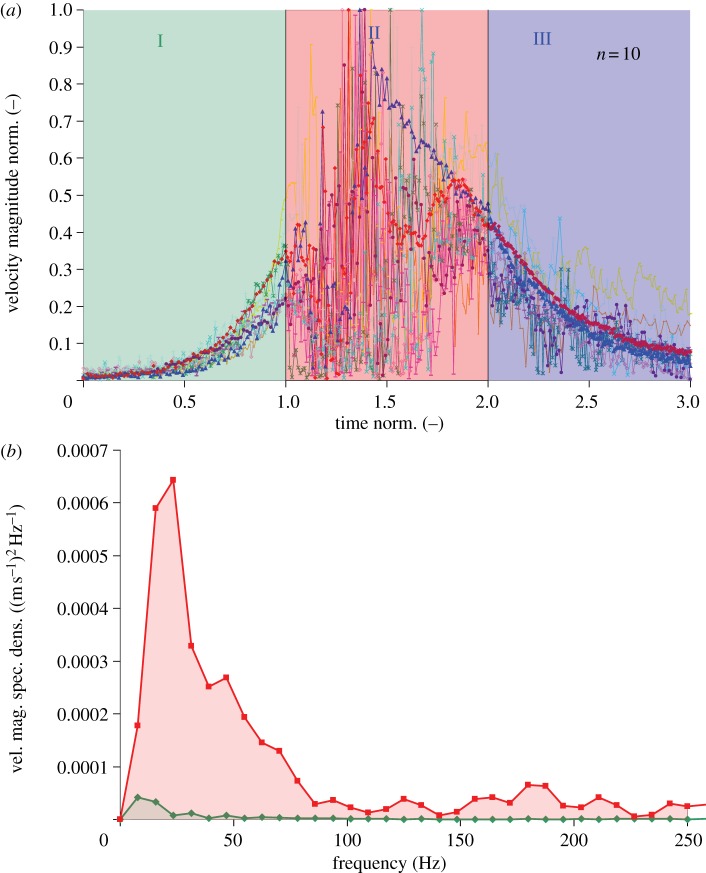
(a) Velocity magnitude of air flow generated close to tarsal trichobothria (see orange circles in figure 7a) by a freely flying blowfly passing by above the spider (N = 5, n = 10). Each velocity signal was normalized, its maximum representing 1, thus allowing the comparison between different experiments. The time regarding the three phases was normalized as well, with phase I ranging from 0 to 1, phase II from 1 to 2 and phase III from 2 to 3. (b) Spectral density of velocity magnitude (vel. mag. spec. dens.) of phases I and II of fly-generated flow above the tarsus of leg 1 (see orange circle in figure 7a). Values on the y-axis are equivalent to squared velocity magnitude relative to the spectrum's bin width. In each of the 68 experiments (N = 20), both the peak frequency of and the energy contained in phase II were larger than those of phase I. Green diamonds with continuous line, leg 1: phase I; red squares with continuous line, leg1: phase II.
Air flow above spider legs. The air flow signature of a blowfly flying freely over a spider leg showed three characteristic phases (figure 8).
Phase I. When the approaching fly was still around 4 cm (3.84 ± 0.56 cm, N = 19, n = 31) away from the spider's closest leg, the velocity signal was first seen above the tarsus of this leg and increased exponentially with time owing to the flow in front of the fly (figure 8a). The fly's horizontal distance from the tarsus at the moment of increased air flow velocity was independent of the fly's altitude in all 19 flights. This allows the spider to always detect the fly at roughly the same horizontal distance. The temporal exponential growth rates describing the increase of the velocity of these airflows during phase I varied between 16 and 79 s−1 (N = 20, n = 74) and increased linearly with the horizontal flight velocity (figure 9). The r.m.s. values (fluctuations, table 1) around the exponential fit were 0.014 ± 0.007 m s−1 (N = 20, n = 62) and the relative fluctuations (fluctuations/mean, table 1) 33 ± 17% (N = 20, n = 62). The maximum ratios of the velocities simultaneously measured above the different legs (see figure 7a for measurement sites) for each flight ranged from 2.2:1 to 6.5:1 (mean: 4.04 ± 1.32, 20 flights).
Figure 9.
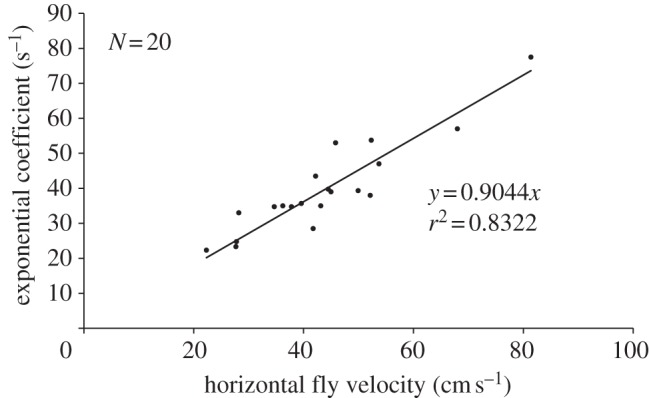
Linear increase of exponential growth rate of the absolute flow velocity in phase I with the fly's horizontal flight velocity.
When the flow field changed from phase I to phase II, the approaching fly was still slightly ahead of the closest tarsus (0.096 ± 0.550 cm, N = 20, n = 60).
Phase II. When the fly—on average—was directly above the tarsus, the trichobothria were abruptly exposed to the highly fluctuating flow of the fly's wake (figure 8a). The r.m.s. values of the fluctuations increased (p < 0.0001, Wilcoxon signed-rank test; null hypothesis: no difference) by an order of magnitude (0.113 ± 0.050 m s−1, N = 20, n = 62) when compared with those of phase I and the mean value of the relative fluctuations (70 ± 23%, N = 20, n = 62) was more than twice as large as that of phase I. The frequency spectra of phases I and II showed one characteristic peak each (figure 8b). Averages of the peak frequencies (68 measurements, 20 flights) were significantly higher (p < 0.0001, Wilcoxon signed-rank test, null hypothesis: no difference) for phase II (17.92 ± 4.49 Hz) than for phase I (8.16 ± 1.62 Hz, table 1). The standard deviations of the peak frequencies of phase I were less than half as large as those of phase II. Different from phase I (upper frequency limit: 84.4 ± 33.0 Hz, table 1), phase II contained frequencies up to 250 Hz (upper limit of measurement range) and several smaller peaks between 100 and 250 Hz (figure 8b).
Phase III. When the blowfly was located approximately 3 cm (2.98 ± 0.74 cm, N = 19, n = 31) beyond the spider's tarsus, the air flow decayed again (figure 8a).
Within all three phases, the air flow velocity was larger than 1 mm s−1 and therefore above the detection threshold of the trichobothria [8].
The resulting flow vector in the vertical symmetry plane is composed of a horizontal and a vertical component in a Cartesian coordinate system. During phase I, the horizontal velocity component contributed more to the flow than the vertical component owing to the predominantly horizontal circulating flow below the fly. During phase III, the vertical velocity components were larger than the horizontal ones owing to the almost vertical ‘downwash’ in the wake behind the fly (figure 7). During phase II, the contribution of the horizontal component decreased, whereas that of the vertical component increased.
Figure 10 illustrates the airflow above the spider's legs 1–4 when a blowfly passed by above it. For the spider, the flow first started above the leg closest to the approaching fly and then moved with the fly across the spider. The time differences (Δt) between the onsets of the airflow above leg 1 and leg 4 varied from 0.038 to 0.108 s (table 1). As expected, Δt decreased with increasing flight velocity (horizontal component) of the fly. However, the linear dependence between Δt and the horizontal component of the fly's velocity as shown in figure 11 only applied within the velocity range shown (13 and 81 cm s−1). Outside this range, the curve is a negative power function with Δt → ∞ for the fly velocity → 0 and Δt → 0 for the fly velocity → ∞. The potential use of the differences in flow arrival times for prey localization will be a topic of the discussion.
Figure 10.
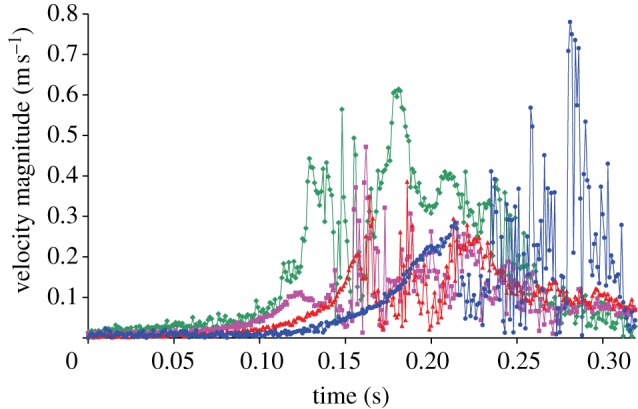
Time-resolved velocity magnitude of the fly-induced airflow above all four legs on one side of the spider (measuring points, see figure 7a). The fly approached the spider from in front (from the right in figure 7) with its trajectory parallel to the spider's symmetry axis. Diamonds with continuous line, leg 1; squares with continuous line, leg 2; triangles with continuous line, leg 3; circles with continuous line, leg 4.
Figure 11.
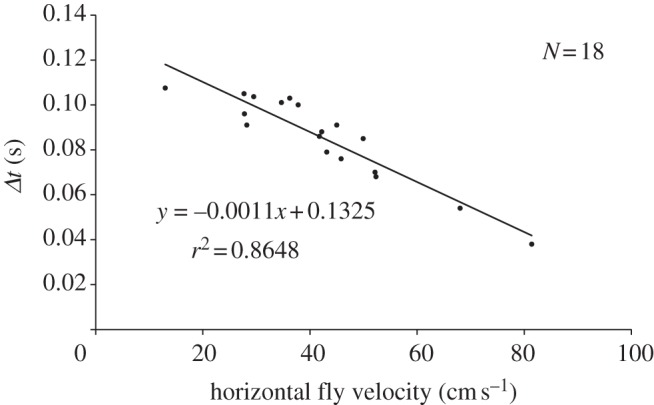
Time differences (Δt) resulting from the delayed onset of the airflow generated by the blowfly at legs 1 and 4 (measured at the two outermost circles in figure 7a).
The exponential coefficients (growth rates) of phase I measured for 20 flights increased linearly with increasing horizontal flight speed (figure 9). In addition, the fluctuation of the velocity magnitude around the exponential fit also depended linearly on the fly's altitude above the spider. It increased from approximately 0.010 m s−1 to ca 0.018 m s−1 between 20 and 60 mm altitude of the fly.
4. Discussion
4.1. Sound pressure fields around Calliphora erythrocephala and Lucilia sericata
Around the blowfly (C. erythrocephala), the sound field of the first harmonic was similar to that of a dipole (figure 3a–c), whereas that of the second harmonic was more rounded like that of a monopole (figure 3a′–c′). These findings are in good agreement with those of Sueur et al. [26] for Lucilia sericata. For Calliphora, the pressure levels of the first harmonic exceeded those of the second harmonic at all measured positions, whereas, according to Sueur et al. [26], the first harmonic is larger in front of Lucilia only and the second harmonic dominant on its sides.
4.2. The necessity to work with freely flying insects
The flow field around the fly differed for the stationary humming fly, the tethered and artificially moved fly and the freely flying fly.
(i) When flapping its wings, a stationary fly generates a wake pointing downwards and backwards (figure 4). The resulting momentum moves the fly forward and upward against gravity. Owing to continuity (conservation of mass), the surrounding air is sucked towards the front side of the wings, a phenomenon reminiscent of a stationary ventilator that blows out air on one side and sucks it in at the other.
Barth & Höller [8] already reported properties of the fly wake. They measured mean air flow velocities of up to 1 m s−1 inside its cone-shaped volume. This value agrees well with our present measurements of up to 1.2 m s−1 in five out of six flies. Only one fly generated air flow velocities as large as 2.4 m s−1.
(ii) The flow field changed when the humming fly was manually moved forward at various horizontal velocities (figure 6). The changes depended on the velocity difference ΔV between the pulling speed (Vpull) and the velocity the fly would have assumed when flying freely (Vfree). As Vfree could not be measured, two pulling velocities (Vpull) outside the range of the flight velocity of the blowfly [22,27] were chosen to reach negative (Vpull clearly smaller than Vfree) and positive (Vpull clearly larger than Vfree) values for ΔV. In this way, it was possible to at least qualitatively determine the effects. With Vpull clearly smaller than Vfree, air is still sucked towards the wings from in front (figure 6a) as in the case of a stationary humming fly. The velocity of the suction flow increases with the absolute value of −ΔV (compare figure 6a,b). When the fly is moved substantially faster than Vfree (+ΔV), the air in front of the fly is pushed ahead of it (figure 6d) because more air is pushed away by the manually moved fly than the fly sucks by its wing beat to generate the wake.
The change of the flow field by pulling the fly with a velocity differing from Vfree also affects the results of the behavioural experiments with a manually moved fly, as will be explained in the companion paper [10]. It causes both a comparatively low jumping rate of the spider and a large standard deviation of the fly's horizontal distance to the spider when it jumps to catch it.
What does the flow field around other insects look like when they are manually moved? To our knowledge, no data exist in the literature where insects were manually moved forward as in our experiments. Instead, stationary tethered insects were exposed to laminar background flow in a wind tunnel. This situation is equivalent to moving the tethered flying blowfly forward together with the camera. In order to make our results comparable to the data provided by Dickinson & Götz [28], the stationary position of the camera in our experiment was compensated for by subtracting the pulling velocity from the resulting velocity field. Dickinson & Götz [28] investigated the flow field around the fruitfly Drosophila melanogaster, whereas Barth et al. [7] measured that around a blowfly. In both cases, the fly was stationary and tethered in a wind tunnel which generated a laminar flow. The cone-shaped wake region pointing downwards and backwards from the fly took on an increasingly horizontal orientation with increasing background flow [7]. At background flow velocities of 0.12 m s−1, the velocities inside the cone measured up to 1 m s−1 [7]. Our present results also show a cone-shaped region of increased velocities of up to 1.5 m s−1 when the fly is pulled at 0.10 m s−1. Likewise, the wake's angle with regard to the horizontal plane increased with higher background velocities. Dickinson & Götz [28] detected a similarly shaped wake region with increased velocities of up to 0.7 m s−1 behind the fruitfly in the wind tunnel (background flow: 0.2 m s−1). The relative smallness of the velocities is due to the smaller size and mass of the fruitfly when compared with the blowfly. Drosophila needs less lift to overcome gravity. In addition, the formation of a wake during the tethered flight of the hawkmoth Manduca sexta at various background velocities [29] shows that bigger insects (wingspan of approx. 10 cm) produce a wake pointing downwards and backwards as well. Behind and below a smaller moth (Galleria sp.), air flow velocity values of approximately 0.4 m s−1 were measured at a distance of 3.5 cm (R. Müllan 2011, unpublished data). The reader is also referred to the wind tunnel visualizations by the Bomphrey group [30].
(iii) When the blowfly is flying freely, air is circulating around its front half as the wake now moves with the fly. The structure of the flow field did not change qualitatively at horizontal flight speeds between 13 and 81 cm s−1 (26 analysed flights). This is different from the flow field generated around a tethered flying blowfly manually moved forward. In the latter case, the flow field changed considerably with the speed at which the fly was pulled forward. As mentioned earlier, the reason for this difference is differences between the pulling speed (Vpull) and the velocity the fly would have assumed when flying freely (Vfree), even when Vpull is in the range of Vfree (figure 6b). The conclusion is that a freely flying blowfly has to be used when investigating the fly-generated airflow around the flow sensors of Cupiennius. As the circulating flow in front of the freely flying blowfly was also found once in the case of a blowfly manually moved forward (figure 6c) during this experiment, the pulling speed presumably equalled the velocity at which the fly would have flown had it been flying freely (ΔV = 0).
The circulating airflow around the blowfly increases the pressure below and decreases the pressure above it, thereby increasing the lift. Unfortunately, we know of no other quantitative data describing the flow field around freely flying insects.
The reader is referred to the companion paper [10], which deals with the behavioural reaction of the spider to the clues contained in the flow field generated by freely flying flies and used to guide its remarkable prey-capture jump towards flying prey.
Acknowledgements
We are grateful to have been funded by the DARPA BioSenSE Program grant no. FA9550-05-1-0459 to F.G.B. We also thank the late J.A.C. Humphrey for his valuable advice and C.F. Schaber and T. Hoinkes for helpful discussions and assistance in the laboratory. The technical advice received from N.A. Andersen and K. Dörner (Dantec Dynamics A/S) is much appreciated.
References
- 1.Barth F. G. 2002. A spider's world. Senses and behavior. Berlin, Germany: Springer [Google Scholar]
- 2.Barth F. G., Wastl U., Humphrey J. A. C., Devarakonda R. 1993. Dynamics of arthropod filiform hairs. II. Mechanical properties of spider trichobothria (Cupiennius salei KEYS.). Phil. Trans. R. Soc. Lond. B 340, 445–461 10.1098/rstb.1993.0084 (doi:10.1098/rstb.1993.0084) [DOI] [Google Scholar]
- 3.Humphrey J. A. C., Devarakonda R., Iglesias J., Barth F. G. 1993. Dynamics of arthropod filiform hairs. I. Mathematical modelling of the hair and air motions. Phil. Trans. R. Soc. Lond. B 340, 423–444 10.1098/rstb.1993.0083 (doi:10.1098/rstb.1993.0083) [DOI] [Google Scholar]
- 4.Humphrey J. A. C., Devarakonda R., Iglesias I., Barth F. G. 1998. Errata re. Humphrey et al. 1993. Phil. Trans. R. Soc. Lond. B 352, 1995 [Google Scholar]
- 5.Humphrey J. A. C., Barth F. G., Reed M., Spak A. 2003. The physics of arthropod medium-flow sensitive hairs: biological models for artificial sensors. In Sensors and sensing in biology and engineering (eds Barth F. G., Humphrey J. A. C., Secomb T. W.), pp. 129–144 New York, NY: Springer [Google Scholar]
- 6.Humphrey J. A. C., Barth F. G. 2008. Medium flow-sensing hairs: biomechanics and models. Adv. Insect Physiol. 34, 1–80 10.1016/S0065-2806(07)34001-0 (doi:10.1016/S0065-2806(07)34001-0) [DOI] [Google Scholar]
- 7.Barth F. G., Humphrey J. A. C., Wastl U., Halbritter J., Brittinger W. 1995. Dynamics of arthropod filiform hairs. III. Flow patterns related to air movement detection in a spider (Cupiennius salei Keys.). Phil. Trans. R. Soc. Lond. B 347, 397–412 10.1098/rstb.1995.0032 (doi:10.1098/rstb.1995.0032) [DOI] [Google Scholar]
- 8.Barth F. G., Höller A. 1999. Dynamics of arthropod filiform hairs. V. The response of spider trichobothria to natural stimuli. Phil. Trans. R. Soc. Lond. B 354, 183–192 10.1098/rstb.1999.0370 (doi:10.1098/rstb.1999.0370) [DOI] [Google Scholar]
- 9.Brittinger W. 1998. Trichobothrien, Medienströmung und das Verhalten von Jagdspinnen (Cupiennius salei Keys.). Dissertation, University of Vienna, Austria [Google Scholar]
- 10.Klopsch C., Kuhlmann H. C., Barth F. G. Submitted Airflow elicits a spider's jump towards airborne prey. II. Flow characteristics guiding behavior. [DOI] [PMC free article] [PubMed] [Google Scholar]
- 11.Vogel S. 1966. Flight in Drosophila. I. Flight performance of tethered flies. J. Exp. Biol. 44, 567–578 [Google Scholar]
- 12.Vogel S. 1967. Flight in Drosophila. II. Variations in stroke parameters and wing contour. J. Exp. Biol. 46, 383–392 [DOI] [PubMed] [Google Scholar]
- 13.Vogel S. 1967. Flight in Drosophila. III. Aerodynamic characteristics of fly wings and wing models. J. Exp. Biol. 46, 431–443 [DOI] [PubMed] [Google Scholar]
- 14.Brodsky A. K. 1994. The evolution of insect flight. Oxford, UK: Oxford University Press [Google Scholar]
- 15.Ellington C. P., van den Berg C., Willmott A. P., Thomas A. L. R. 1996. Leading-edge vortices in insect flight. Nature 384, 626–630 10.1038/384626a0 (doi:10.1038/384626a0) [DOI] [Google Scholar]
- 16.Dickinson M. H., Lehmann F.-O., Sane S. 1999. Wing rotation and the aerodynamic basis of insect flight. Science 284, 1954–1960 10.1126/science.284.5422.1954 (doi:10.1126/science.284.5422.1954) [DOI] [PubMed] [Google Scholar]
- 17.Nachtigall W. 2003. Insektenflug: Konstruktionsmorphologie, Biomechanik, Flugverhalten. Berlin, Germany: Springer [Google Scholar]
- 18.Sane S. P. 2003. The aerodynamics of insect flight. J. Exp. Biol. 206, 4191–4208 10.1242/jeb.00663 (doi:10.1242/jeb.00663) [DOI] [PubMed] [Google Scholar]
- 19.Birch J. M., Dickson W. B., Dickinson M. H. 2004. Force production and flow structure of the leading edge vortex on flapping wings at high and low Reynolds numbers. J. Exp. Biol. 207, 1063–1072 10.1242/jeb.00848 (doi:10.1242/jeb.00848) [DOI] [PubMed] [Google Scholar]
- 20.Lehmann F.-O., Sane S. P., Dickinson M. H. 2005. The aerodynamic effects of wing–wing interaction in flapping insect wings. J. Exp. Biol. 208, 3075–3092 10.1242/jeb.01744 (doi:10.1242/jeb.01744) [DOI] [PubMed] [Google Scholar]
- 21.Bomphrey R. J., Lawson N. J., Harding N. J., Taylor G. K., Thomas A. L. R. 2005. The aerodynamics of Manduca sexta: digital particle image velocimetry analysis of the leading-edge vortex. J. Exp. Biol. 208, 1079–1094 10.1242/jeb.01471 (doi:10.1242/jeb.01471) [DOI] [PubMed] [Google Scholar]
- 22.Schilstra C., van Hateren J. H. 1999. Blowfly flight and optic. I. Thorax kinematics and flight dynamics. J. Exp. Biol. 202, 1481–1490 [DOI] [PubMed] [Google Scholar]
- 23.Dring R. P. 1982. Sizing criteria for laser anemometry particles. J. Fluids Eng. 104, 15–17 10.1115/1.3240844 (doi:10.1115/1.3240844) [DOI] [Google Scholar]
- 24.Kanmya K. 2005. Communication by vibratory signals in Diptera. In Insect sounds and communication. Physiology, behavious, ecology, and evolution (eds Drosopoulos S., Claridge M. F.), pp. 381–396 Boca Raton, FL: CRC Press [Google Scholar]
- 25.Dahl F. 1883. Über die Hörhaare bei den Arachniden. Zool. Anz. 6, 267–270 [Google Scholar]
- 26.Sueur J., Tuck E. J., Robert D. 2005. Sound radiation around a flying fly. J. Acoust. Soc. Am. 118, 530–538 10.1121/1.1932227 (doi:10.1121/1.1932227) [DOI] [PubMed] [Google Scholar]
- 27.Bomphrey R. J., Walker S. M., Taylor G. K. 2009. The typical flight performance of blowflies: measuring the normal performance envelope of Calliphora vicina using a novel corner-cube arena. PLoS ONE 4, e7852. 10.1371/journal.pone.0007852 (doi:10.1371/journal.pone.0007852) [DOI] [PMC free article] [PubMed] [Google Scholar]
- 28.Dickinson M. H., Götz K. G. 1996. The wake dynamics and flight forces of the fruit fly Drosophila melanogaster. J. Exp. Biol. 199, 2085–2104 [DOI] [PubMed] [Google Scholar]
- 29.Willmott A. P., Ellington C. P., Thomas A. L. R. 1997. Flow visualization and unsteady aerodynamics in the flight of the hawkmoth, Manduca sexta. Phil. Trans. R. Soc. Lond. B 352, 303–316 10.1098/rstb.1997.0022 (doi:10.1098/rstb.1997.0022) [DOI] [Google Scholar]
- 30.Bomphrey R. J. 2012. Advances in animal flight aerodynamics through flow measurement. Evol. Biol. 39, 1–11 10.1007/s11692-011-9134-7 (doi:10.1007/s11692-011-9134-7) [DOI] [Google Scholar]


