
Figure 4.
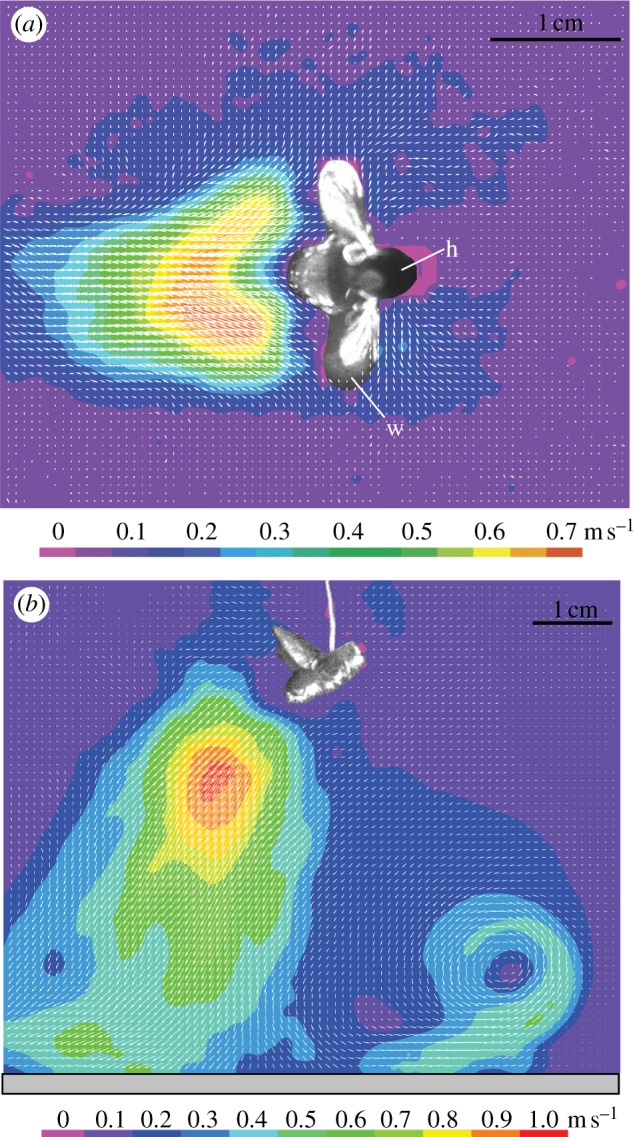
(a) Flow field around a stationary flying blowfly in a horizontal plane 5 mm below the level where the wings are attached to the fly's thorax and with a horizontally orientated Perspex plate (30 × 15 cm2) located 5 cm below the fly. The vector map shows the calculated mean of 150 individual velocity fields (measurement duration for each 0.15 s). Colours refer to different velocity magnitudes (see scale). w, wing; h, head. (b) Flow field around a stationary flying blowfly in the vertical symmetry plane of the fly and with a horizontally orientated Perspex plate (see grey bar) located 5 cm below the fly taking ‘ground effects’ into account.