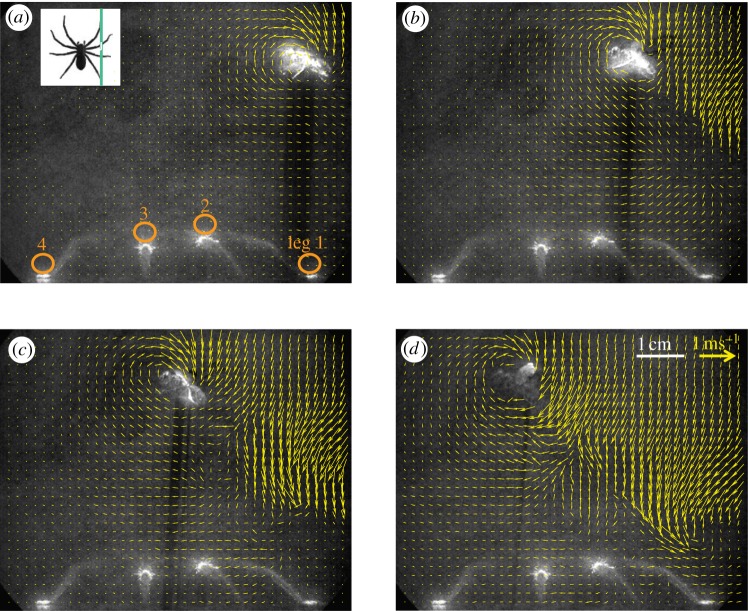
Figure 7.
(a–d) Temporal sequence (time intervals: a,b: 27 ms, b,c: 22 ms, c,d: 28 ms) of vector maps showing the flow field around a freely flying blowfly approaching from the right. The illumination of the fly indicates that it flew directly within the measurement plane (laser light sheet). All four legs on the right side of the spider were cut by the laser light sheet providing measurement points above the tarsus of legs 1 and 4 and above the tibia of legs 2 and 3 (orange circles in part a; see also figure 1b). The flow fields evaluated for 26 flights of freely flying blowflies all showed the same general pattern. Inset: spider seen from above and position of laser sheet indicated by green line.

