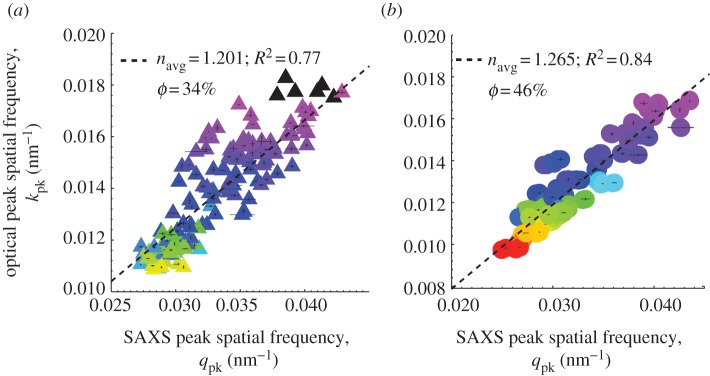
Figure 8.
Regression plots of the primary optical peak hue from normal incidence reflectance measurements expressed as peak spatial frequency (kpk = 2π/λpk) against the dominant spatial frequency of structural correlations (qpk) measured using SAXS for (a) channel- (shaded triangles) and (b) sphere-type (shaded circles) nanostructures. For both nanostructural classes, the size of the nanostructural periodicity measured by SAXS strongly predicts, i.e. scales with the measured primary peak hue, demonstrating that the underlying barb nanostructures are tuned to produce the observed structural colours. The inverse of twice the slope of the regression yields navg, the average or effective refractive index (and hence ϕ, the keratin volume fraction) for each class of nanostructure. The estimated navg and φ for sphere nanostructures on the whole (1.265, 46%) is significantly higher than that for channel morphologies (1.201, 34%) and congruent with predictions of the phase separation hypothesis. The colour of each triangle or circle is coded to the approximate colour of the corresponding feather (UV colours in black). The vertical and horizontal lines at each data point indicate the standard error of the mean (s.e.m).

