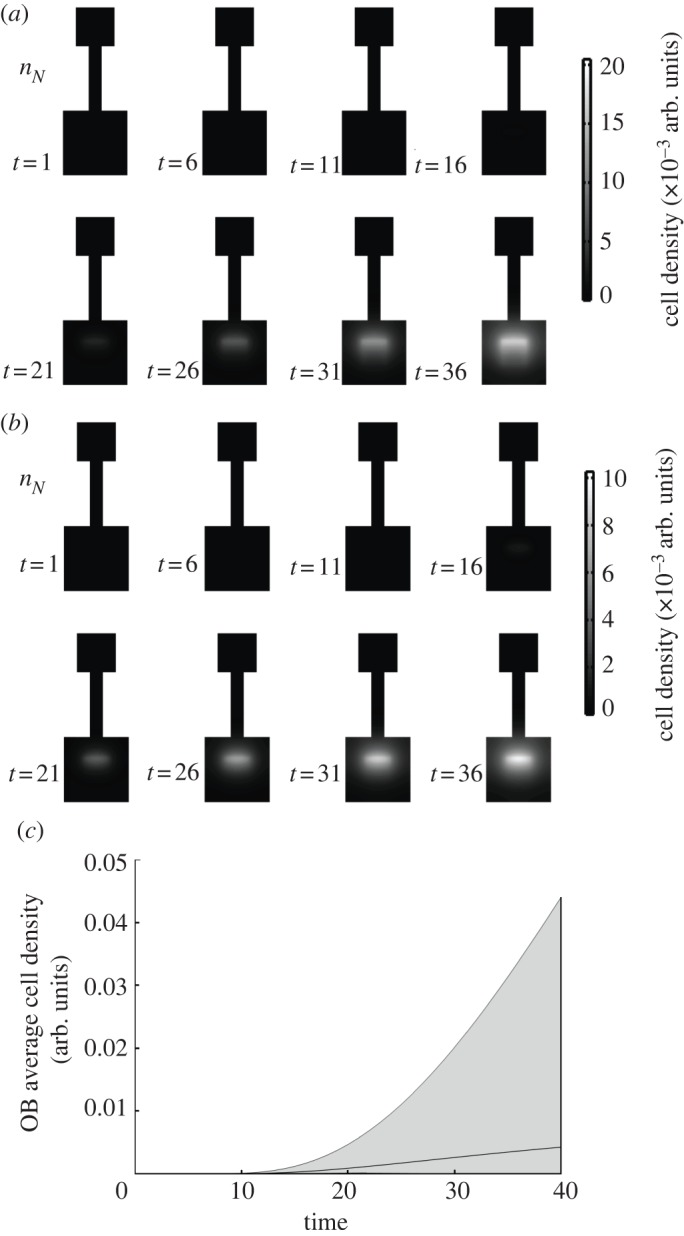
Figure 4.

A direct comparison between the most and least neurogenic (a and b, respectively) solutions obtained through a ±10% perturbation to the parameter space illustrated in figure 3. While the cell density in the OB varies greatly in magnitude between the two spaces (upper and lower bounds on the shaded region in (c); unperturbed solution in black), the overall behaviour changes very little.
