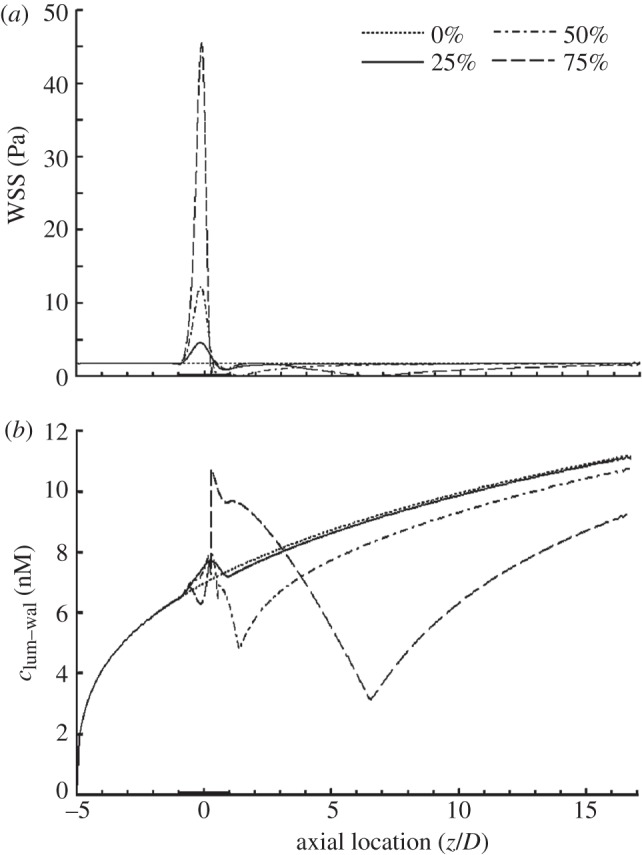
Figure 7.

Comparison between stenoses with different area reductions. (a) WSS distribution and (b) NO distribution at the lumen–wall interface (clum–wal). In this set of simulations, Re = 270 and blood is assumed to be a Newtonian fluid. The dashed line indicates 75%; dashed-dotted line, 50%; solid line, 25%; dotted line, 0%.
