
Figure 10.
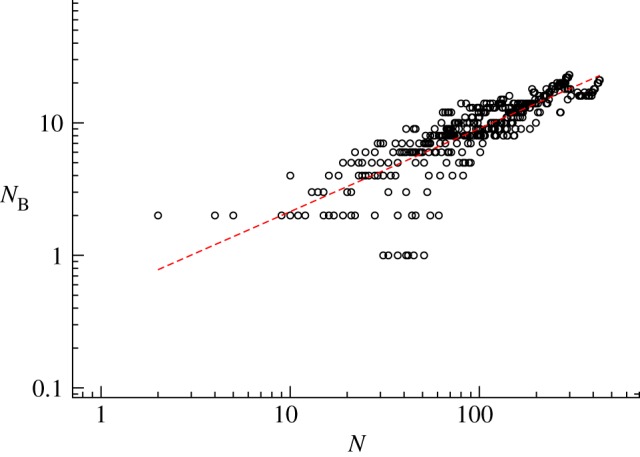
The log–log plot of the number of different branches versus the number of stations for the different subway networks considered here. The dashed line is a power law fit with exponent ≈0.6. (Online version in colour.)
Official websites use .gov
A
.gov website belongs to an official
government organization in the United States.
Secure .gov websites use HTTPS
A lock (
) or https:// means you've safely
connected to the .gov website. Share sensitive
information only on official, secure websites.
The log–log plot of the number of different branches versus the number of stations for the different subway networks considered here. The dashed line is a power law fit with exponent ≈0.6. (Online version in colour.)