Figure 11.

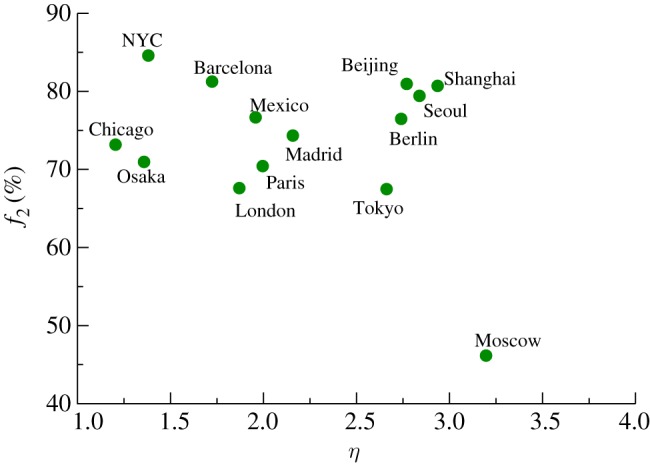
Relation between the spatial extension of branches and the degree of interconnection in the core. The 2009 values for the percentage f2 of k = 2 core nodes and η are plotted for 12 city subways. (Online version in colour.)

Relation between the spatial extension of branches and the degree of interconnection in the core. The 2009 values for the percentage f2 of k = 2 core nodes and η are plotted for 12 city subways. (Online version in colour.)