
Figure 8.
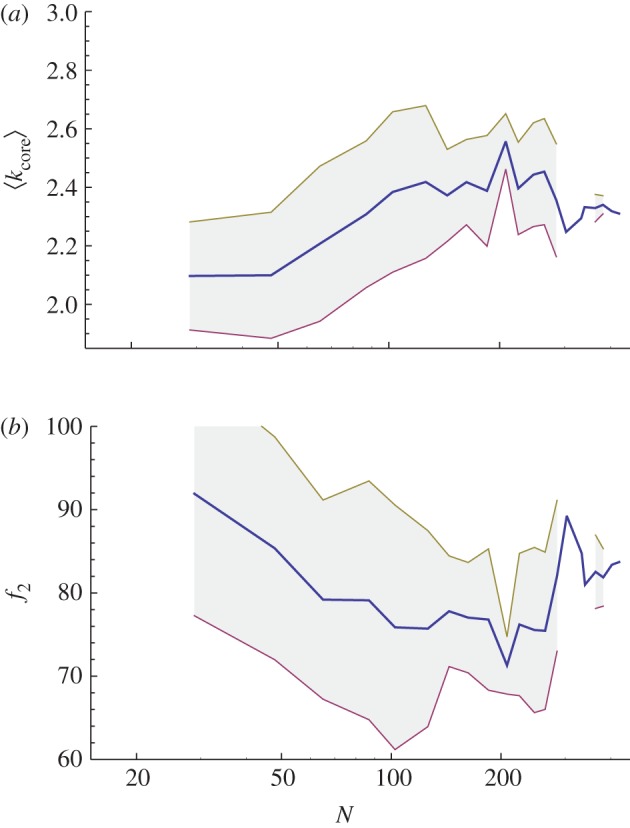
(a) Average degree of the core  (equation (3.3)) and its dispersion versus number of stations (averaged over 20 bins). (b) Evolution of the percentage f2 of k = 2 core nodes (averaged over 20 bins). (Online version in colour.)
Official websites use .gov
A
.gov website belongs to an official
government organization in the United States.
Secure .gov websites use HTTPS
A lock (
) or https:// means you've safely
connected to the .gov website. Share sensitive
information only on official, secure websites.
(a) Average degree of the core (equation (3.3)) and its dispersion versus number of stations (averaged over 20 bins). (b) Evolution of the percentage f2 of k = 2 core nodes (averaged over 20 bins). (Online version in colour.)