
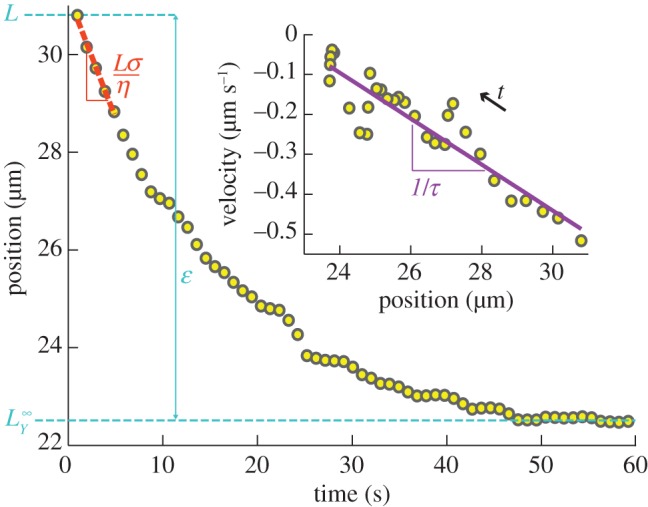
Figure 2.
Model-independent measurement of strain  , stress-to-viscosity ratio
  and relaxation time τ. The wound margin position (ellipse semi-axis) is plotted versus time after severing; data from figure 1b–d, see electronic supplementary material, movie S3, along the y-axis. The difference between the initial (L) and final (
 ) positions (blue dashed lines) directly yields the value of
  The initial velocity
  (slope of the orange dashed line) yields an estimate of
  . Inset: velocity, estimated by finite differences of successive positions, versus the position during the first 30 s. An arrow indicates the direction of increasing time t. The slope of a linear fit (purple line) yields the inverse of the relaxation time,
  (see equation (3.2)).