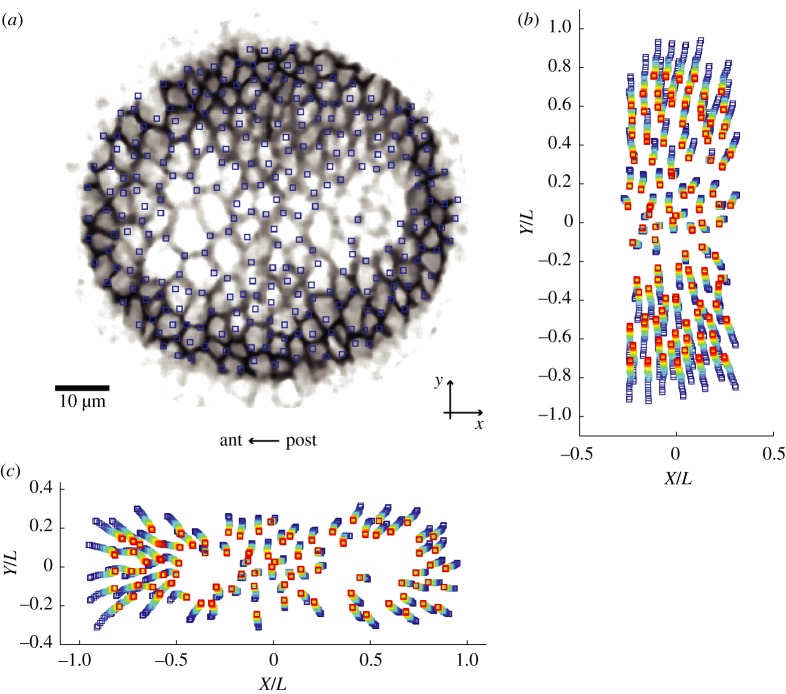
Figure 4.
Tracking of feature positions. (a) Positions of features (blue squares), old pupa, data of figure 1c after image denoising. The logarithms of intensity levels are represented in grey scale, and contrast is inverted for clarity. (b) Tracking for the first 30 s (time colour-coded from blue to red), inside a rectangle along the y-axis. (c) Same for the x-axis.

