
Figure 5.
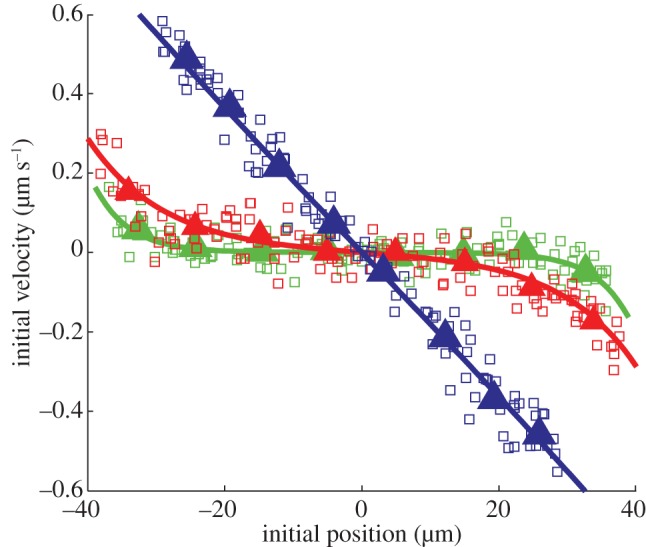
Model-dependent measurement of the friction-to-viscosity ratio ξ. Initial velocity profiles immediately after severing are plotted versus initial position prior to severing, for three typical pupae: young (green), middle-aged (red) and old (blue). Open squares: features, from figure 4b. Closed triangles: same, spatially averaged in eight bins. Lines: fit by a sinh function (equation (3.6)), yielding for ξ a value above, in, or below the measurable range:  (green),
  5 (red),
  (blue), respectively.