
Figure 7.
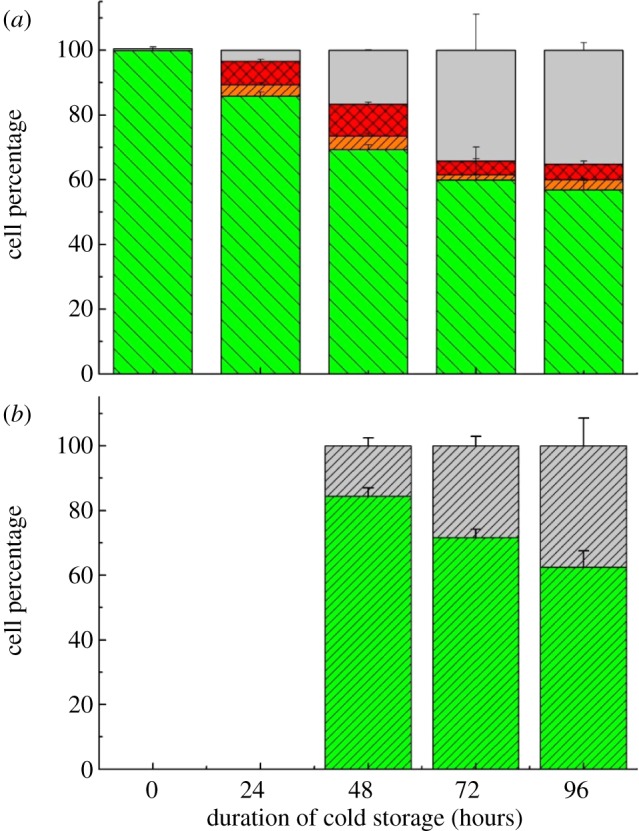
Samples exposed to different cold storage durations: (a) flow cytometry measurements of percentage of subpopulations and (b) trypan blue measurements of viable and dead cells. (a) Grey bars, dead; red bars with stripes, apoptotic; orange bars with stripes, early apoptotic; green bars, viable. (b) Green bars with stripes, viable; grey bars with stripes, dead. (Online version in colour.)