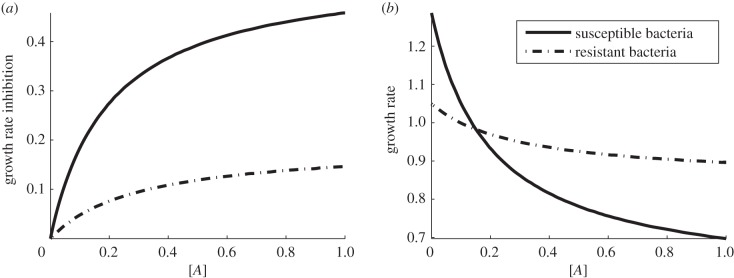
Figure 1.
(a) Growth rate inhibition as a function of antibiotic concentration (the dimensionless growth inhibition denoted γ(A) throughout this section). (b) Growth rate (per hour) as a function of antibiotic concentration in the environment with maximum resource available S ≡S0. Here we see that the antibiotic-resistant phenotype (dashed line) has a higher growth rate than the susceptible strain (solid line) when the antibiotic concentration is high. The fitness cost associated with resistance is expressed by having a lower growth rate when the antibiotic concentration, A, is low.

