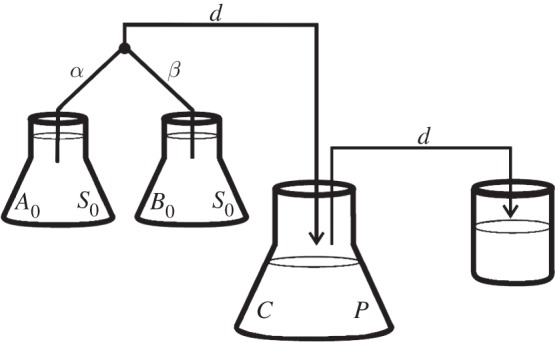
Figure 4.

A diagram of a chemostat adapted to supply antibiotic A at a rate α and antibiotic B at a rate β, while maintaining the volume and supply rate of limiting resources (held at concentration S0) at a constant rate. In this diagram, the constraint α + β = d must apply because fluid and biomass flows from left to right in the diagram along the black lines as indicated by the arrows.
