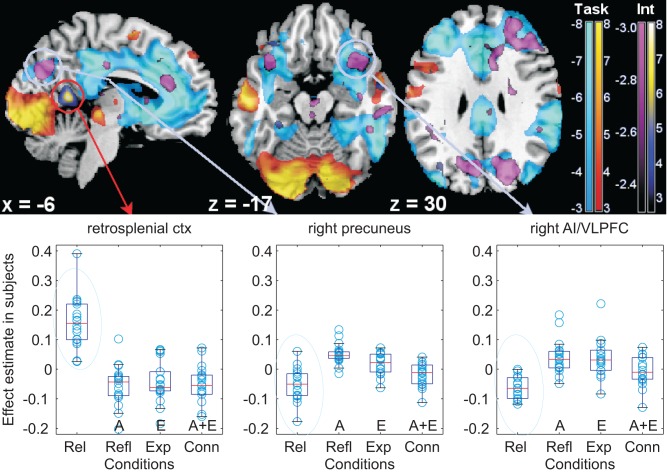
Figure 5.
Interaction between emotional and abstract story versions. Top: illustration of the spatial overlap between the interaction emotion and abstraction and the deactivations of the main task (light blue). Statistical maps of t-values overlaid on a template T1-weighted brain. As in Figure 3, yellow/orange denotes task activations, light blue deactivations relative to fixation, thresholded for display purposes at p = 0.005, uncorrected. The interaction is in yellow/blue or in violet (according to its direction). These areas may be compared with those of the regression on individual differences of Figure 3, especially for the medial aspect of the brain on the left, and the orbitofrontal cortex. Bottom: box-plots of signal differences between conditions. The light blue circles highlight the textual version where neither abstract nor emotional words were used, and which drives the interaction. For an explanation of the symbols of the box-plots, see the legend of Figure 3. AI/VLPFC: anterior insula/ventrolateral prefrontal cortex; ctx: cortex; Int: interaction.

