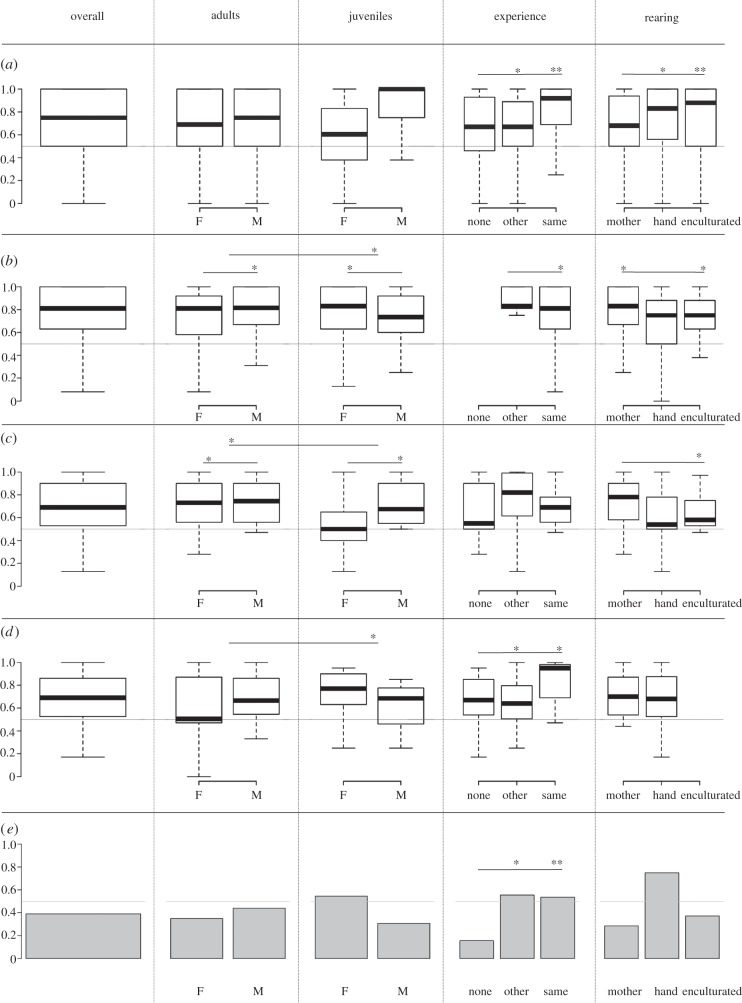
Figure 2.
Success rate by individual characteristics in experiments of (a) object permanence, (b) object properties, (c) causality transfer, (d) causality training and (e) mirror self-recognition. The black lines in the boxplots (a–d) depict the median percentage of trials solved in a given experiment, with boxes and whiskers indicating the quantiles. Values are based on raw data and can contain multiple entries per individual. The bars in (e) depict the percentage of individuals deemed by experimenters to have passed the mark test. Lines above the boxplots and bars connect values that are significantly different in GLMM analyses, correcting for other factors. Stars indicate significant differences: two stars indicate categories with significantly higher success rates than those with one star, which in turn had higher success rates than those with no stars. Note that, as the figure shows raw data, not controlling for other significant factors, some significant differences are not apparent from visual inspection alone.

