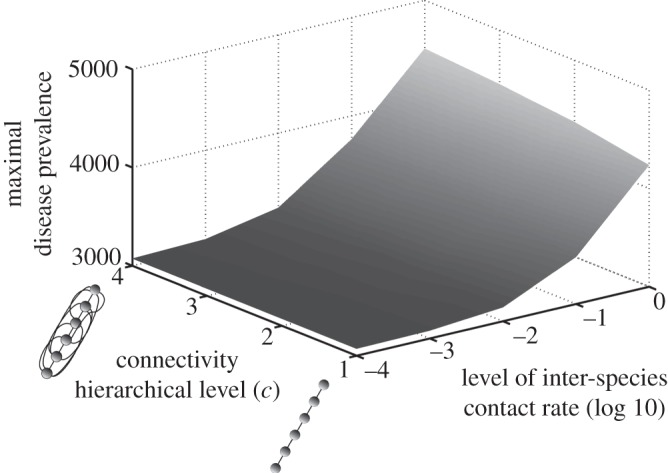
Figure 3.

Influence of contact patterns between host species on peak disease prevalence. The small cartoons represent an example with different values of c (number of species connected to a single species). Parameters used: z = 0.1, Y0 = 10, a = 0.6931, b = 0,  days, k = 0.1,
  .
.
