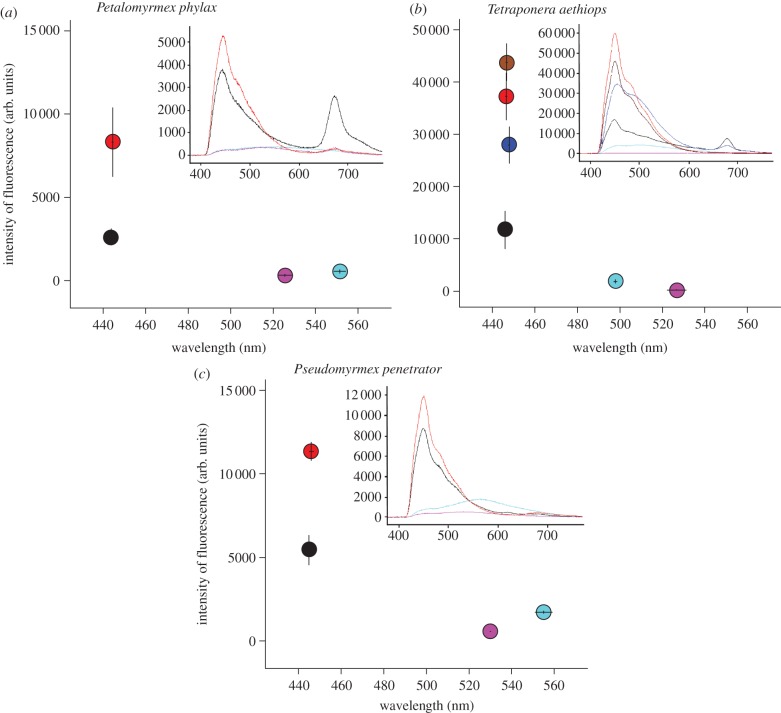
Figure 2.
Wavelength and intensity of the most intense fluorescence obtained by microspectrofluorometry under excitation at 365.5–368.5 nm for hyphae of the fungal patch labelled with calcofluor (red), hyphae of the fungal patch in control domatia (pink), plant cell from the inner wall of a domatium in which the fungal patch was labelled with calcofluor (light blue), part of larval gut showing bluish fluorescence (black), hyphae in infrabuccal pellet of workers (and one winged female; dark blue) and hyphae in larval trophothylax (brown), for the three study systems. Means ± s.e. The inserts within each graph show examples of fluorescence emission spectra for each of the above items.

