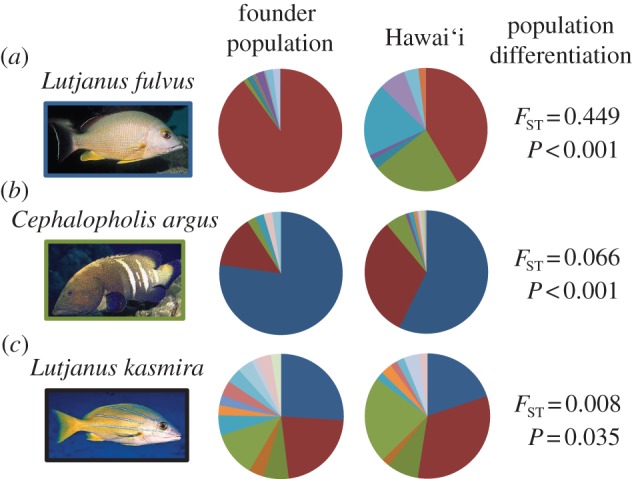
Figure 3.

Haplotype frequencies for (a) L. fulvus, (b) C. argus, and (c) L. kasmira. We estimated cyt b haplotype distributions in founder populations as the product of contemporary haplotype frequencies in the source populations and the number of individuals introduced from each of those sources (see the electronic supplementary material, tables S1 and S2). Differences in haplotype frequencies between the founder and introduced populations were detected using AMOVA and an exact test of population differentiation as implemented in Arlequin v. 3.5 [36]. The resulting F-statistic and the associated p-value from the AMOVAs are shown. All comparisons were significant using the exact test (p < 0.001; data not shown). Photo credit: Keoki and Yuko Stender.
