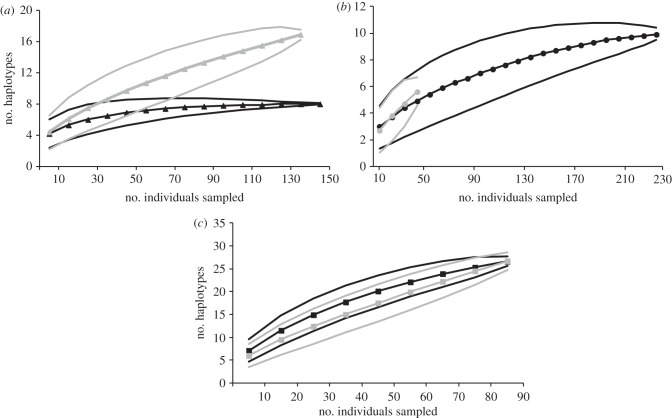
Figure 4.
Rarefaction curves plotting the number of individuals sampled against the expected number of mitochondrial haplotypes were calculated using the Analytic Rarefactation v. 1.4 software available at the UGA Stratigraphy Lab website (http://www.uga.edu/~strata/software/) for (a) L. fulvus, (b) C. argus, and (c) L. kasmira. Grey lines represent data from the source populations and black lines represent data from the introduced range. Also, 95% confidence limits are shown (number of species ±1.96 * sqrt (var)).

