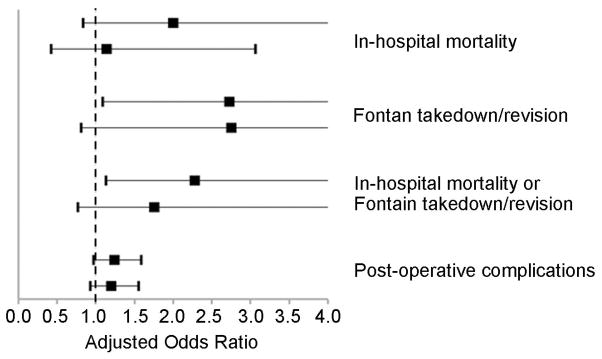
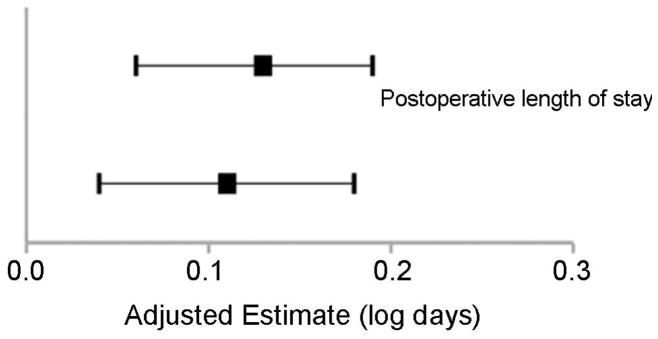
Figure 2.
Results of Sensitivity Analysis (extracardiac conduit vs. lateral atrial tunnel Fontan).
A. Dichotomous Outcome Variables. Adjusted odds ratios (black box), and 95% confidence intervals (line) are shown. The line of unity (odds ratio=1.0) is depicted by the dotted line. B. Continuous Outcome Variables. Adjusted estimates (black box; log days), and 95% confidence intervals (line) are shown. The line of unity in this case is represented by the solid line where the adjusted estimate = zero. Lateral atrial tunnel Fontan serves as the reference for all data shown. In both A. and B., two point estimates are shown for each outcome variable. In all cases, the top estimate represents that obtained from the main models, while the bottom estimate represents that obtained from the conditional models used to address potential center effects. In all cases, results were generally similar between the main model results and the conditional model results.


