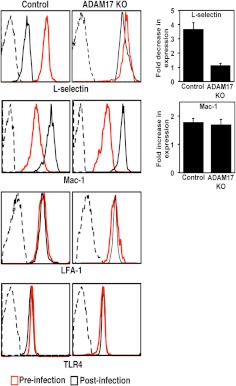
Figure 3. ADAM17 activation in circulating neutrophils during bacterial infection.
The relative surface expression levels of L-selectin, LFA-1, Mac-1, and TLR4 were determined by flow cytometry on peripheral blood neutrophils from control and conditional ADAM17 knockout mice, 2 h after E. coli challenge (5×10⁷ CFU). For all histogram plots, isotype-matched negative control antibody staining is indicated by dashed lines. y-axis, Cell number; x-axis, Log 10 fluorescence. Data are representative of four mice in each group. The bar graphs show the average fold decrease in L-selectin surface expression and average fold increase in Mac-1 surface expression for neutrophils from control or conditional ADAM17 knockout mice following E. coli challenge. Results are expressed as the mean (±sd) of four mice in each group.

