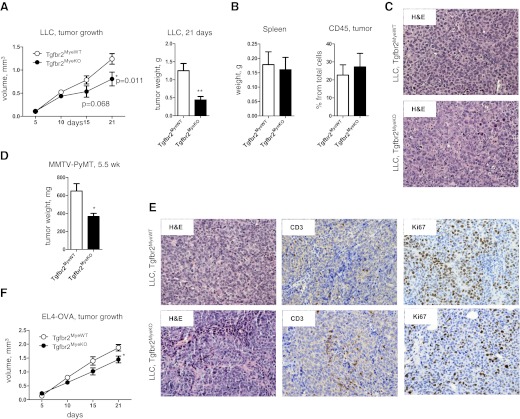
Figure 2. Tumor growth.
(A) LLC growth after s.c. injection (left) and LLC tumor weight on Day 21 after s.c. injection (right). (B) Weight of spleen (left) and number of CD45+ cells in tumor tissue (right) in LLC tumor-bearing mice upon sacrifice on Day 21 of tumor progression. Data correspond with the mean ± sem of five individual mice from two experiments. (C) H&E staining indicated morphological changes in LLC tumors in Tgfbr2MyeWT and Tgfbr2MyeKO mice. (D) Tumor weight of MMTV-PyMT carcinoma cells implanted into the #4 mammary fat pad. Data correspond with the mean ± sem of five individual mice from two experiments. (E) H&E staining indicated morphological changes in MMTV-PyMT tumors in Tgfbr2MyeWT and Tgfbr2MyeKO mice and IHC staining for CD3 and Ki67 in same type of tumor. (F) Dynamics of tumor growth of EL4-OVA cells injected s.c. Data correspond with the mean ± sem of three individual mice from two experiments. *P < 0.05; **P < 0.01; data correspond with the mean ± sem.

