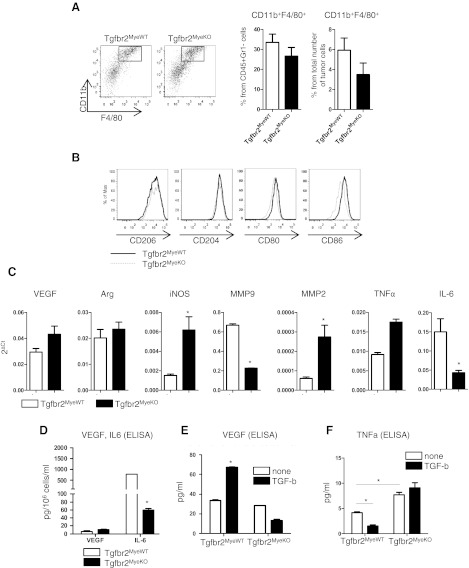
Figure 3. Phenotype and functions of macrophages.
(A) Number of macrophages (CD11b+F4/80+) in tumor tissue. Cells were gated as CD45+Gr1−. Representative FACS plots (left) and quantatative data (right). (B) Flow cytometry data for phenotype of CD11b+F4/80+Gr1− cells in tumor tissue. (C) qRT-PCR data for CD11b+F4/80+Gr1− cells isolated by FACS sorting from LLC tumor tissue. (D) VEGF and IL-6 secretion by macrophages. Cells were isolated from peritoneal area on the 4th day after 4% thioglycolate injection. (E) VEGF and (F) TNF-α secretion stimulated by TGF-β in peritoneal macrophages. *P < 0.05; data correspond with the mean ± sem of two to three individual mice from three experiments.

