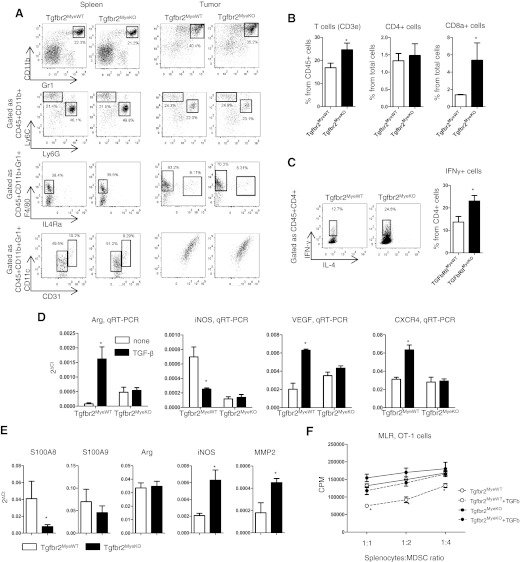
Figure 4. Phenotype and functions of CD11b+Gr1+ cells.
(A) Representative FACS plots of number and phenotype of CD11b+Gr1+ cells in spleen and tumor tissue. (B) Number of T cells in tumor tissue. (C) Intracellular staining of T cells in tumor tissue. Before flow cytometry analysis, single-cell suspension of tumor tissue was stimulated for 6 h by PMA/ionomycin. Data correspond with the mean ± sem of three individual mice from three experiments. (D) Regulation of genes by TGF-β in CD11b+Gr1+ cells. Gr1+ cells were isolated by magnetic microbeads from spleen of tumor-bearing mice and incubated for 24 h with 5 ng/ml TGF-β. After incubation, cells were harvested, and total RNA was isolated. (E) qRT-PCR analysis of CD11b+Gr1+ cells isolated by FACS sorting from tumor tissue. (F) MLR. Gr1+ cells were isolated from spleen by magnetic sorting of tumor-bearing mice and incubated overnight with 5 ng/ml TGF-β, washed, and then mixed with splenocytes from OT-I transgenic mice in the presence of SIINFEKL. Data correspond with the mean ± sem of three individual mice from two experiments. *P < 0.05; data correspond with the mean ± sem.

