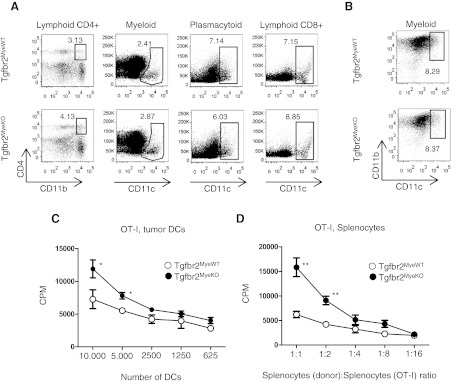
Figure 5. Phenotype and functions of DCs.
(A) Representative FACS plots of a number of subpopulations of DCs in spleen. Flow cytometry strategy is shown in Supplemental Fig. 2A. Lymphoid CD4+ DCs are gated for CD11c+CD8−B220−, myeloid DCs as CD11c+B220−CD8−CD4−, plasmacytoid DCs B220+CD11b−, and lymphoid CD8+ DCs as CD11b−B220−CD4−CD8+. (B) Number of myeloid DCs in tumor tissue; cells are gated as CD45+CD4−CD8−B220−. Data correspond with the mean ± sem of three individual mice from three experiments. (C and D) MLR; DCs were isolated by FACS sorting from EL4-OVA tumor tissue and then mixed in different ratios with splenocytes from OT-I mice (C). MLR; splenocytes from tumor-bearing mice (EL4-OVA) were mixed in different ratios with splenocytes from OT-I mice (D). Data correspond with the mean ± sem of three individual mice from two experiments. *P < 0.05; **P < 0.01; data correspond with the mean ± sem.

