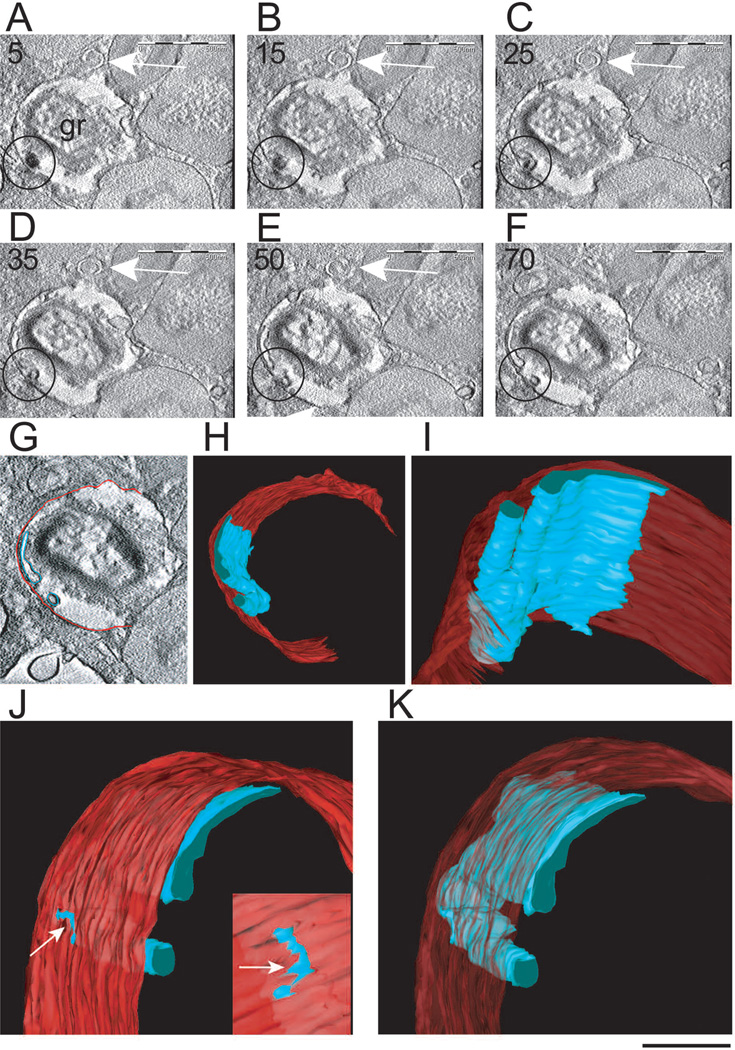
Fig. 6.
Tomographic slices and 3D models from an emptying specific granule. A–F. The tomographic volume shows intragranular sub-compartments in conjunction with mobilized content. Circles indicate the same sub-compartment surrounding part of the electron dense content that is relocated to the granule outer membrane. Note in C and D that the electron density of this membrane changes at the site of contact with the membranous intragranular sub-compartment. The arrows point to a forming Eosinophil Sombrero Vesicle (EoSV). Seventy and five serial single virtual slices as in F were extracted from the tomogram, outer granule membrane was partially traced in red and intragranular vesiculotubular structures were outlined in blue as in G so as to generate 3D models. H–K. 3D models of the same granule show intragranular membrane domains (blue) organized as a flattened tubular network and tubules. In J and K, the model has been rotated to provide another view. An area of continuity between the intragranular membranous network and the limiting granule membrane is indicated in J (arrows). The slices (~ 4 nm of thickness) were extracted from 3D reconstructions of a 400 nm eosinophil section analyzed by automated electron tomography at 200 Kv. The numbers on the upper left corner indicate the slice number through the tomographic volume. gr, granule. Cells were stimulated with eotaxin as in Figure 2 and processed for transmission electron microscopy. Reprinted from (Melo et al., 2005b) with permission. Also see Movie 1 and Movie 2 in supplementary material at www.traffic.dk/videos/6_10.asp. Scale bars: A–F, 500 nm; G, 450 nm; H, 400 nm; I, 180 nm; J, K, 150 nm.

