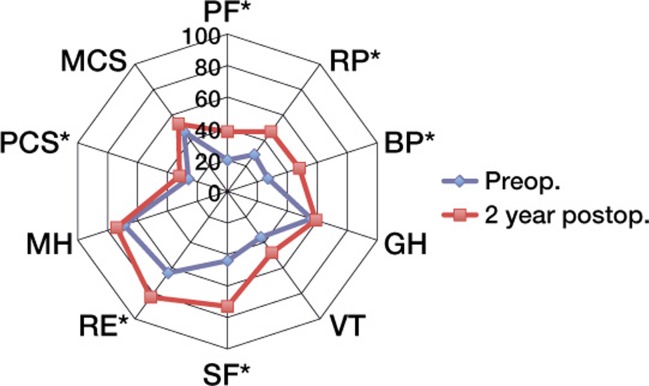
Figure 5.
Radar graph of SF-36 score. Scores with * showed a statistically significant difference (p < 0.05).
PF* Physical function
RP* Role physical
BP* Bodily pain
GH Generic health
VT Vitality
SF* Social functioning
RE* Role emotional
MH Mental health
PCS* Physical component score
MCS Mental component score

