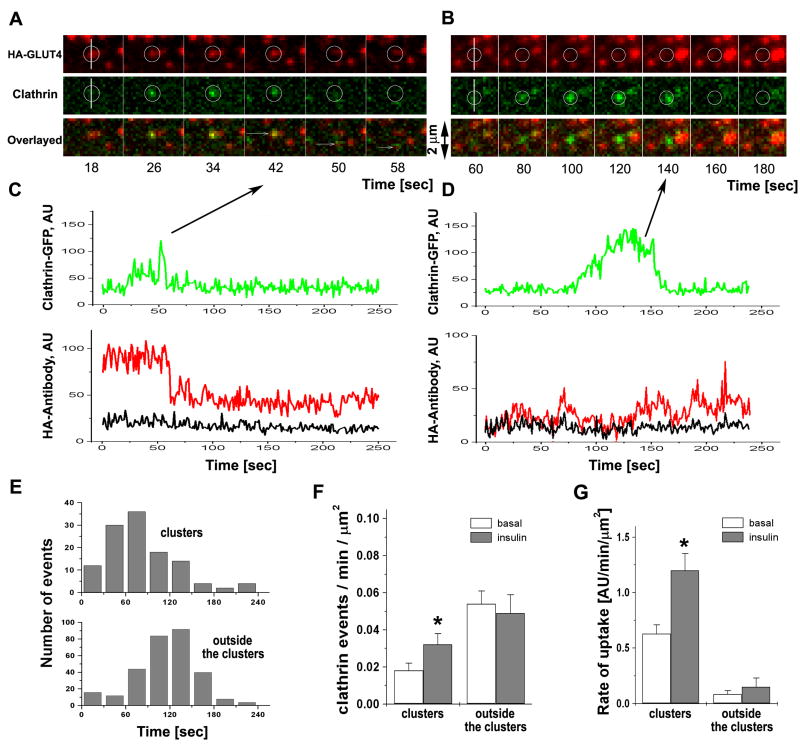
Figure 4. Clathrin endocytic events at, but not outside of, GLUT4 clusters mediate internalization of GLUT4.
Single endocytic events were imaged in isolated rat adipose cells expressing clathrin-GFP and HA-GLUT4 (no fluorescent tag) using multi-color TIRF microscopy (Video 4).
(A) Selected frames show a characteristic transient appearance of clathrin-GFP (green) at the site of a GLUT4 cluster (red), followed by partial removal of HA-GLUT4 from PM detected by HA-antibody conjugated to Alexa-594. The position of the event is shown by a circle in both channels. Individual frames were selected from the stack four sec apart to depict the entire time course of the event.
(B) A representative clathrin event that takes place outside of a GLUT4 cluster identified by HA-antibody does not result in a change in the HA-antibody signal. Individual frames were selected from the stack 10 sec apart to depict the entire time course of the event.
(C) Graphs represent the fluorescent intensity time-courses of HA-antibody (red) and clathrin-GFP (green) for the event shown in (A). The black trace represents the average HA-antibody background intensity outside of clusters. Note that the residual fluorescence signal of HA-antibody after the appearance and disappearance of clathrin-GFP is significantly higher than the background..
(D) Graphs represent the fluorescent intensity time-courses of HA-antibody (red) and clathrin-GFP (green) for the event shown in (B). The black trace represents the average HA-antibody background intensity outside of clusters. Note that the fluorescence signal of HA-antibody is not affected by the assembly of clathrin-GFP and shows no drop at the time of clathrin-GFP removal.
(E) Histogram of the time of the onset of clathrin assembly and disappearance of clathrin-coated pits. The upper panel represents clathrin assembly events at GLUT4 clusters identified by HA-antibody and the lower panel represents clathrin assembly outside the clusters.
(F) The frequency of clathrin events at, and outside of, GLUT4 clusters in the basal and insulin-stimulated steady states. The number of events detected per unit area per min of recording was averaged for 10 cells each in the basal and insulin-stimulated states. Error bars represent SEM, * statistically different from corresponding basal values, p<0.05.
(G) Rate of HA-antibody uptake per unit area of the cell surface. The average rate was calculated from the slope of cumulative uptake measured in 12 cells in three independent experiments. Cumulative uptakes were constructed using all detected decrements of HA-antibody fluorescence corresponding to clathrin events associated with the clusters, as well as all the other clathrin assembly events outside the clusters. The decrements were calculated as the difference of the mean intensity of HA-antibody averaged for 10 frames before and after clathrin disappearance (see Fig. S4). Note that while the numbers of clathrin events at the clusters account for a fraction of the total (see Fig. 4F), they are responsible for the major part of HA-antibody internalization from the cell surface. Error bars represent SEM, * statistically different from corresponding basal values, p<0.05.

