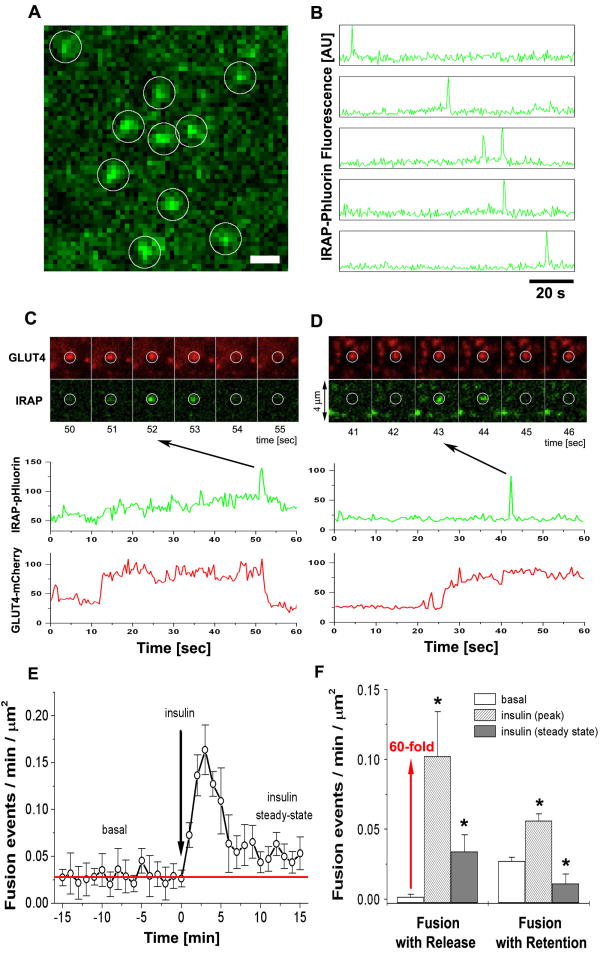
Figure 5. Two modes of exocytosis, fusion-with-retention and fusion-with-release, mediate GLUT4 delivery and spatial distribution in PM.
(A) Isolated rat adipose cells were transfected with the pH-sensitive probe IRAP-pHluorin (green) and HA-GLUT4-mCherry (red), and imaged using multi-color TIRF microscopy. Single exocytosis events were detected as spikes of IRAP-pHluorin fluorescence that reflected opening of the fusion pore and equilibration of the pH inside the lumen of the fusing vesicle. The image represents a maximum projection of a time-lapse stack of 240 frames, i.e. each pixel contains the maximum value over all frames in the stack at the particular pixel location. IRAP-pHluorin events are marked with white circles. See also Fig. S5 and Video 5. Bar, 1 μm.
(B) Time-course of IRAP-pHluorin fluorescence measured in five of the circular regions shown in (A). Note characteristic transient spikes of IRAP-pHluorin marking the fusion pore openings and consequent lateral diffusion of IRAP-pHluorin into PM. At all times the detected IRAP-pHluorin events were associated with the presence of GLUT4-mCherry signal at the same site.
(C) Series of time-frames showing a characteristic fusion event with release of HA-GLUT4-mCherry (red) into PM and corresponding transient spike of IRAP-pHluorin (green) marking the moment of fusion pore opening. The graphs below represent the time-courses of HA-GLUT4-mCherry and IRAP-pHluorin fluorescence measured at the sites of fusion. Note the simultaneous decreases of the GLUT4-mCherry and IRAP-pHluorin signals.
(D) Series of time-frames showing another type of fusion event that retains HA-GLUT4-mCherry (red) at the site of fusion and leads to formation of a GLUT4 cluster. The transient spike of IRAP-pHluorin (green) marks the moment of fusion pore opening, but the HA-GLUT4-mCherry does not disperse upon fusion and remains clustered. The graphs below present the quantification of HA-GLUT4-mCherry and IRAP-pHluorin fluorescence, and show that the GLUT4-mCherry signal remains relatively unchanged after fusion.
(E) Frequency of fusion events detected with IRAP-pHluorin plotted as a function of time before and after insulin stimulation. The number of fusion events detected per unit area during one min of recording was calculated for individual cells and averaged for at least five cells for each time point. Insulin resulted in a significant increase of the fusion frequency, which typically peaked at 3 min after stimulation and then declined towards a level similar to the frequency of fusion events under the non-stimulated condition (red line). Error bars represent SEM.
(F) The frequency of fusion events with retention and release of GLUT4, measured in the basal and insulin-stimulated steady states. The number of fusion events detected per unit area per min of recording was averaged for 20 cells each in the basal and insulin-stimulated states. In insulin-treated cells, the fusion frequency was measured at 3-5 min (peak) and at 13-15 min (steady state) after insulin stimulation. 269 events were analyzed in 16 cells. Error bars represent SEM, * statistically different from corresponding basal values, p<0.05, assessed by one-way ANOVA.

