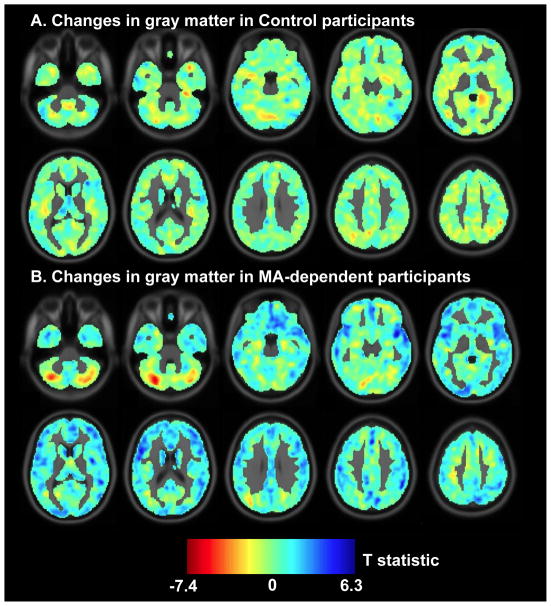
Figure 2. Changes in gray matter during the first month of abstinence from methamphetamine.
T statistic maps showing brain regions where gray matter increased over time (shades of blue) and where it decreased over time (shades of red; R: right hemisphere) in Control (A) and MA-dependent participants (B).

