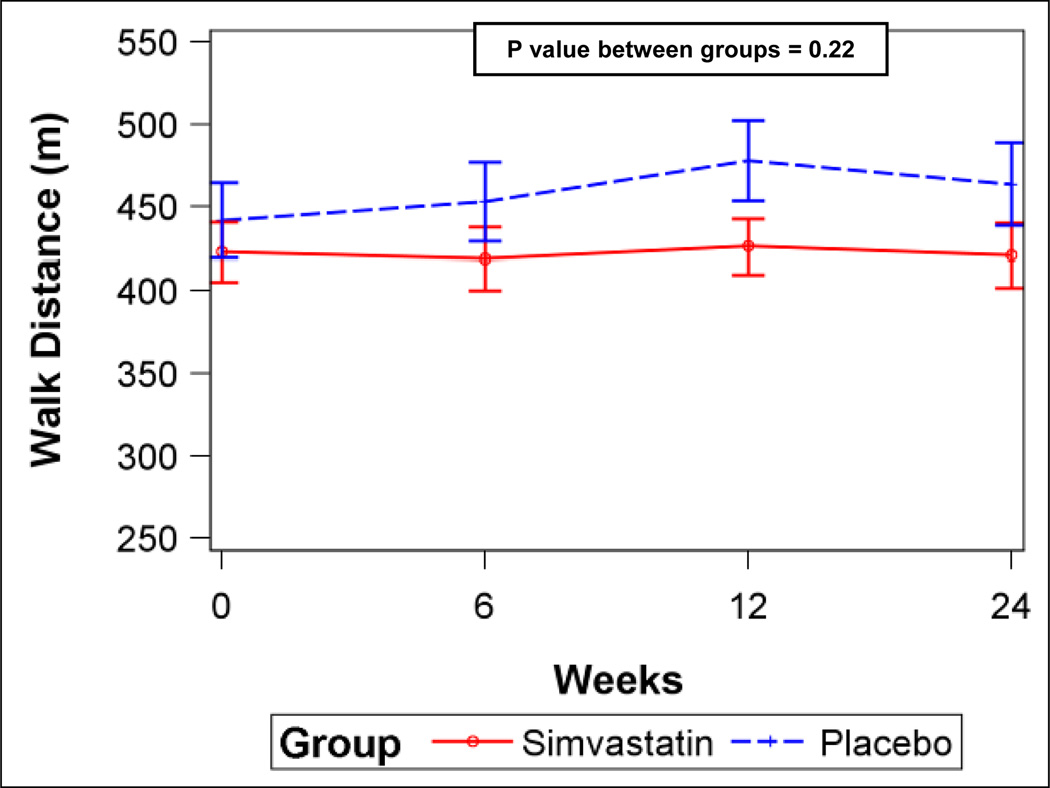
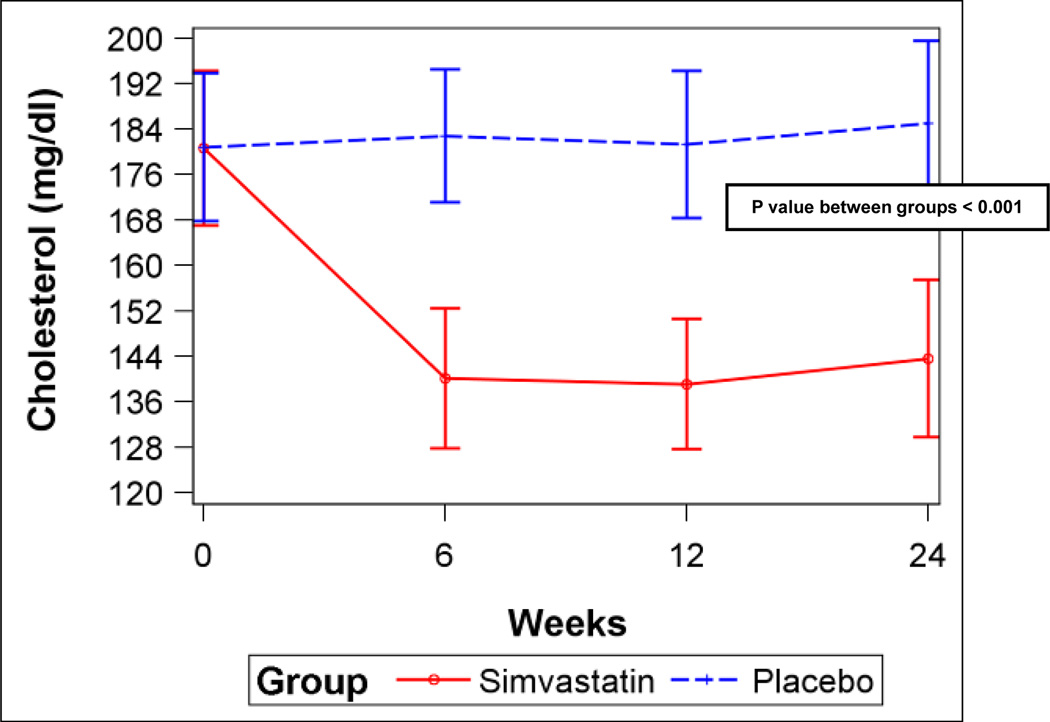
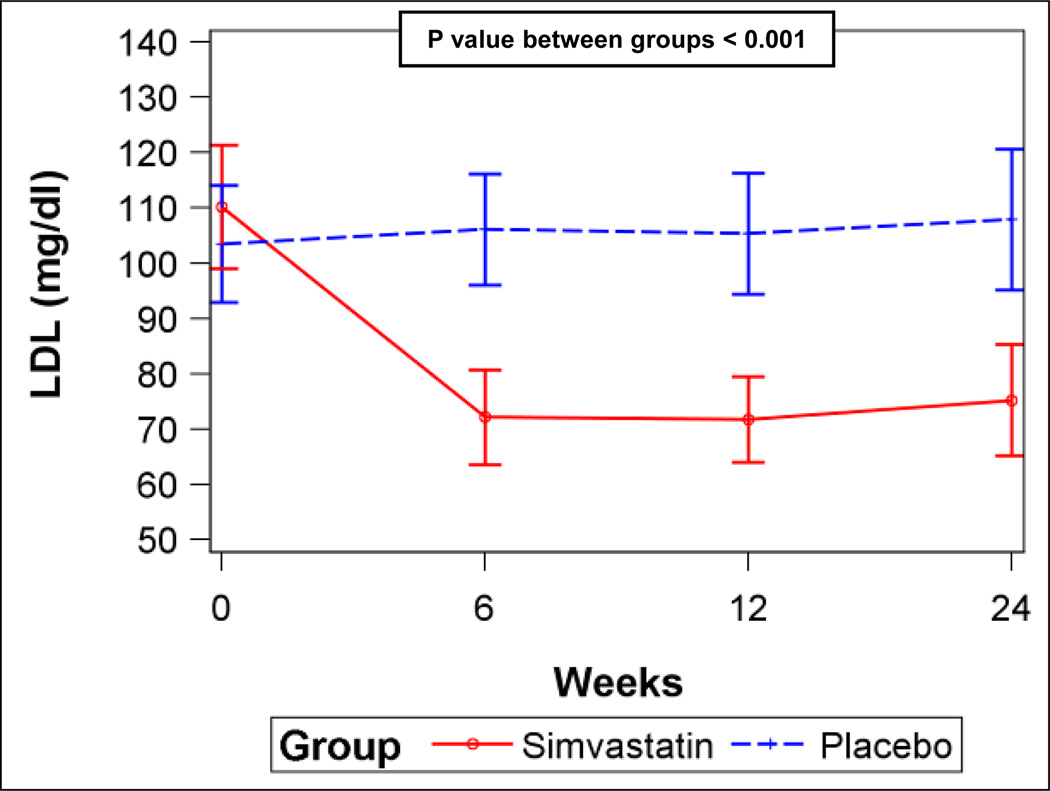
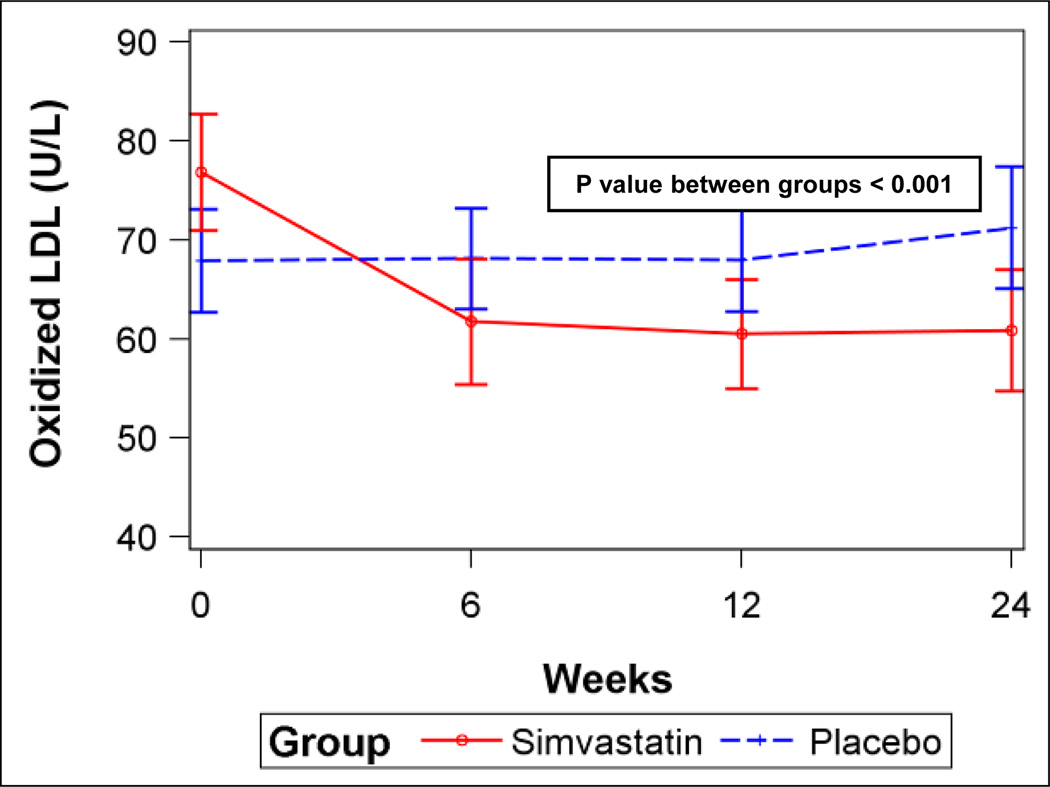
Figure 3.
A) Six-minute walk distance for simvastatin and placebo (error bars are 95% confidence intervals). B) Serum total cholesterol levels for simvastatin and placebo. C) Serum low-density lipoprotein (LDL) levels for simvastatin and placebo. D) Plasma oxidized low-density lipoprotein (LDL) levels for simvastatin and placebo. P values from linear mixed-effects models.


