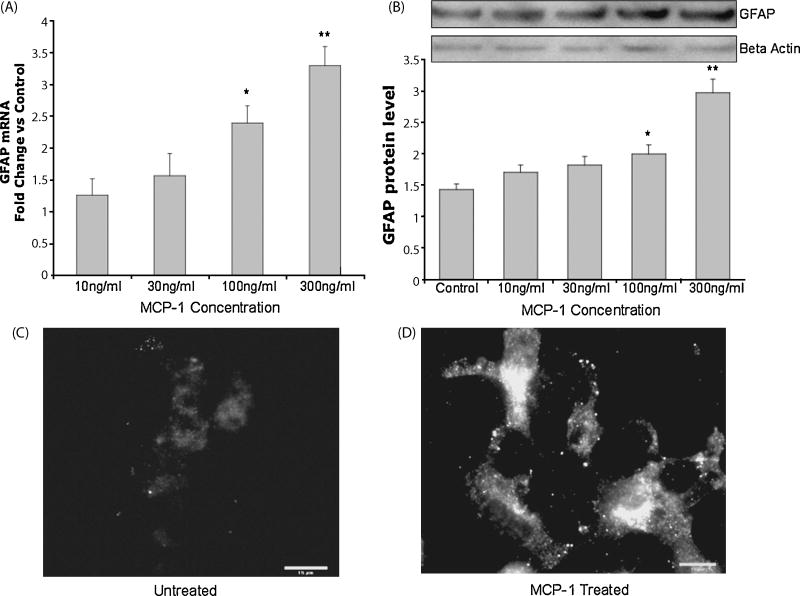
Figure 3. Increased glial fibrillary acidic protein expression and morphological changes caused by MCP-1.
(A) RT-PCR analysis of GFAP in NT2 cells treated with MCP-1 at indicated concentrations. Analyzed 24 hours post treatment. Figure represents fold change vs. control (untreated). (B) Immunoblot analysis of GFAP in cells treated with MCP-1 or untreated after 24 hours. Protein values were normalized to Beta Actin expression. * Indicates statistical significance (*P<0.05, **P<0.01). Immunocytochemistry showing GFAP expression in NT2 cells untreated (C) or treated with MCP-1 (100ng/ml) (D). Analyzed 24 hours after treatment. Scale bar in panel represents 15 μm.

