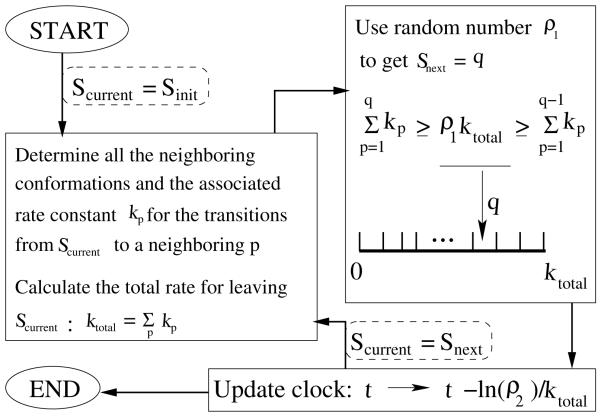
Figure 1.
Flow chart illustrating the steps in the Kinetic Monte Carlo algorithm. Two random numbers ρ1 and ρ2 between 0 and 1 are used in each elementary move during the KMC simulation. ρ1 is used to determine the next conformation Snext from the current conformation Scurrent. ρ2 is used to update the system clock. The simulation is terminated if a sufficiently long time span is reached.

