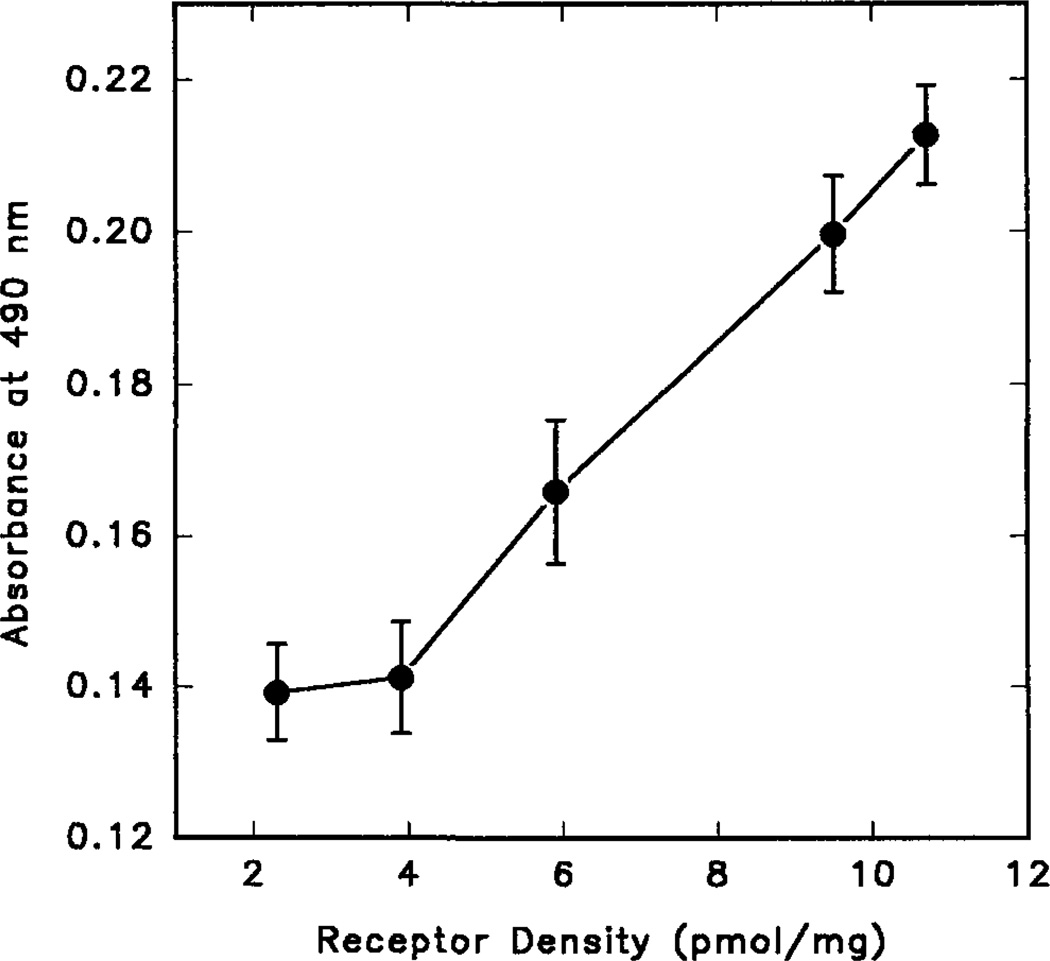
Fig. 4. Correlation between the strength of the absorbance signal determined by the ELISA method and the density (Bmax) of receptors.
The receptor densities were determined by [3H]CGS 21680 saturation binding experiments using transfected COS-7 cells derived from the same plate as those for the ELISA experiments. About 24 h after transfections, aliquots of COS-7 cells were transferred into 96-well plates, and the remaining cells were grown for saturation binding assays. ELISA studies were carried out as described under “Experimental Procedures”.

