Figure 4.
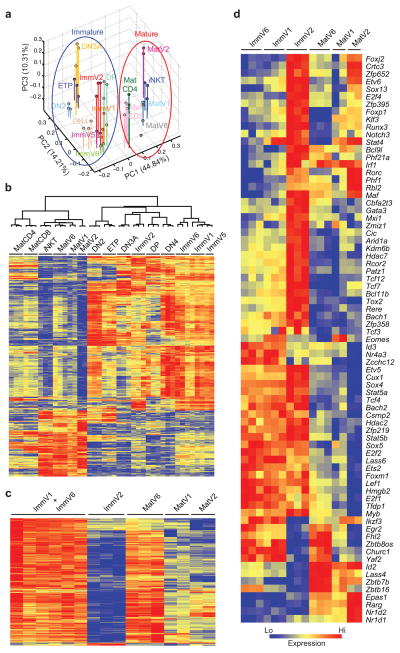
Convergence of gene expression profiles of γδ subsets upon maturation. (a) PCA was performed on the populations shown using the 495 genes that were differentially regulated upon maturation of adult γδ T cells (see Supplementary Fig. 5, Supplementary Table 7). The first three PCs are shown along with the proportion of the total variability represented by each component. (b) Heatmap showing the expression of the 495 genes of the γδ maturation gene signature in precursor, αβ, and γδ T cell subsets. The dendrogram for sample clustering shows that immature and mature subsets form two distinct clusters irrespective of T cell lineage. (c, d) Heatmaps of relative expression of metabolic genes (c) and TFs (d) in immature and mature γδ subsets. For all heatmaps, data were log transformed, gene row centered, and hierarchically clustered by gene and subset, and genes are color coded (see legend) to display relative expression. In (c), interspersed immV1 and immV6 replicates are grouped together.

