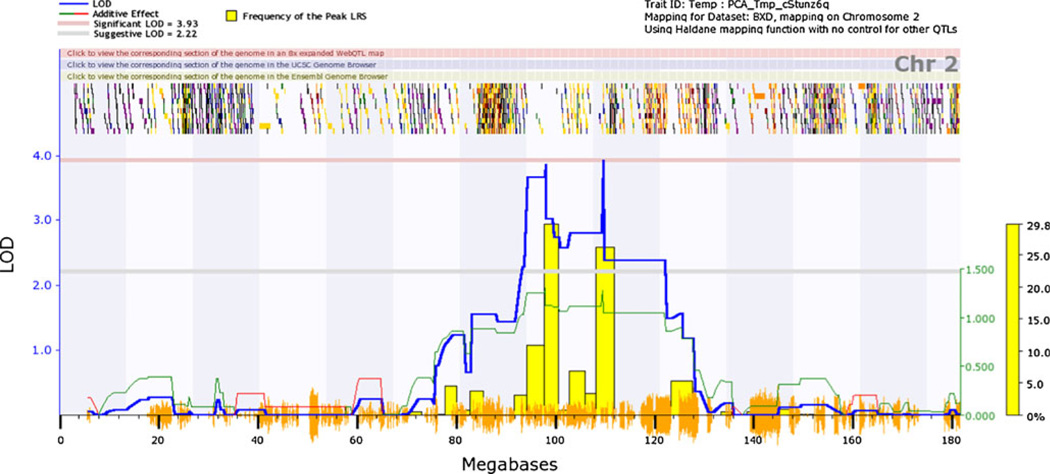
Fig. 2.
QTL for VMB iron concentration on chromosome 2. Mice were assigned either a low iron or control diet upon weaning; iron concentrations were assayed at 120 days of age. Principal components analysis was performed on VMB iron under both dietary conditions and for both sexes. Genome-wide interval mapping plots above show a significant QTL on chromosome 2 (right peak at approximately 109 Mb)

