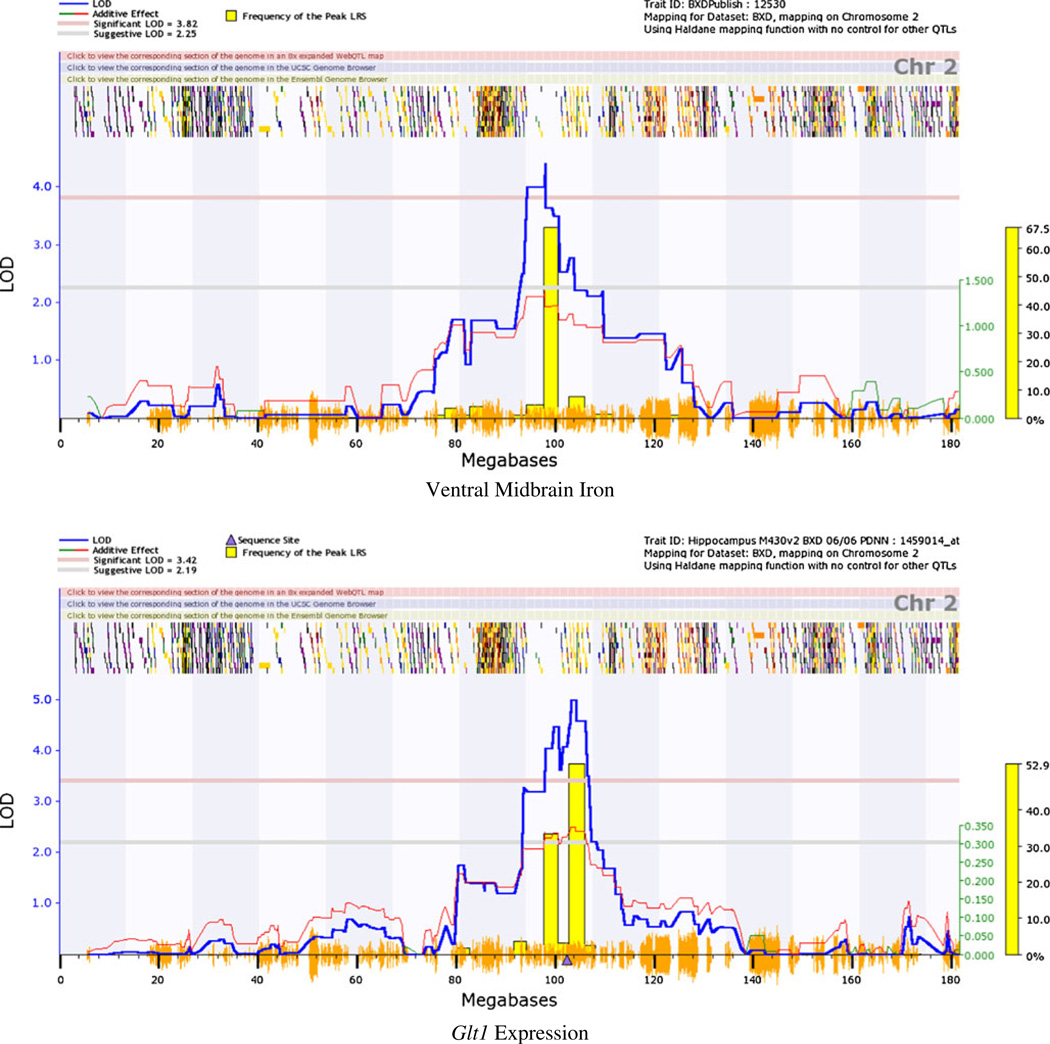
Fig. 3.
Chromosome 2 QTL for VMB iron levels co-maps with cis-eQTL for Glt1 expression. a Interval mapping plot for VMB iron levels showing close-up of chromosome 2. b Interval mapping plot for VTA Glt1 expression levels. Blue line represents LOD score, or strength of association between genetic markers and phenotypic trait. Horizontal red dashed line represents significance threshold determined by 1,000 permutations of the data. Vertical orange dashes on x-axis represent SNPs from a high density map; horizontal dashes near top of the image represent gene locations

